01
Air and soil sensors, without mixing the readings
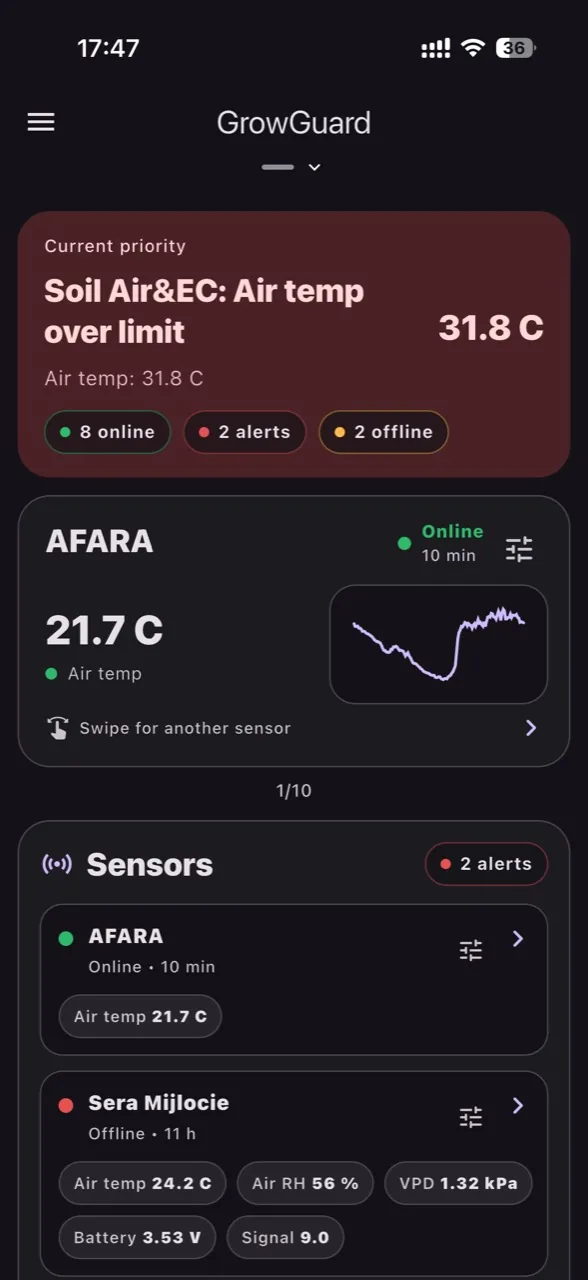
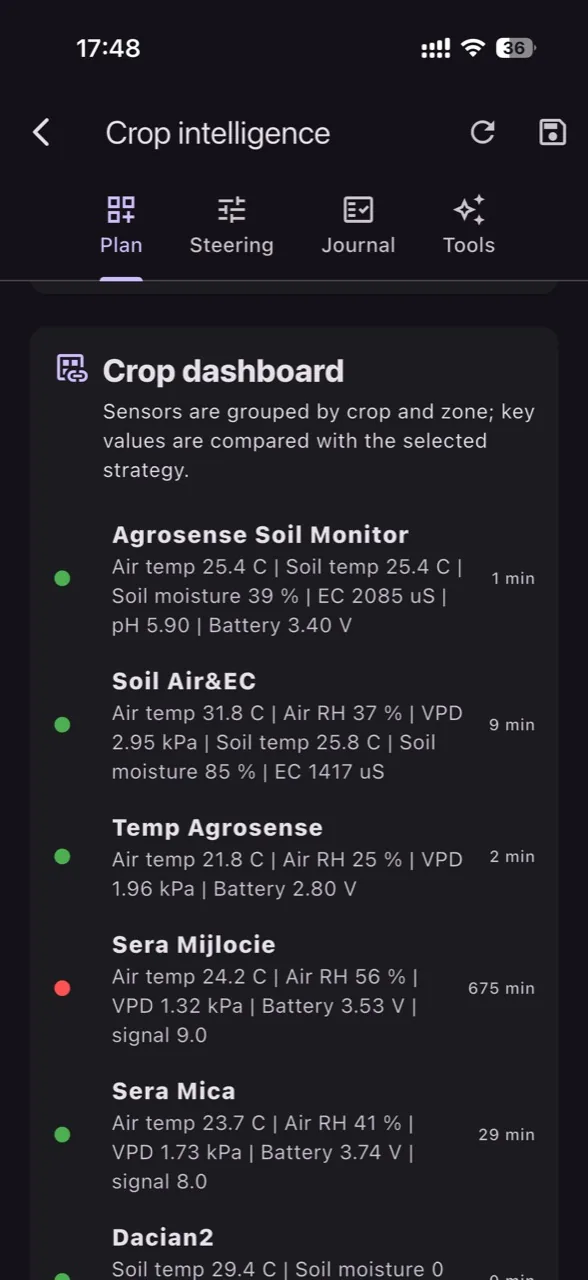
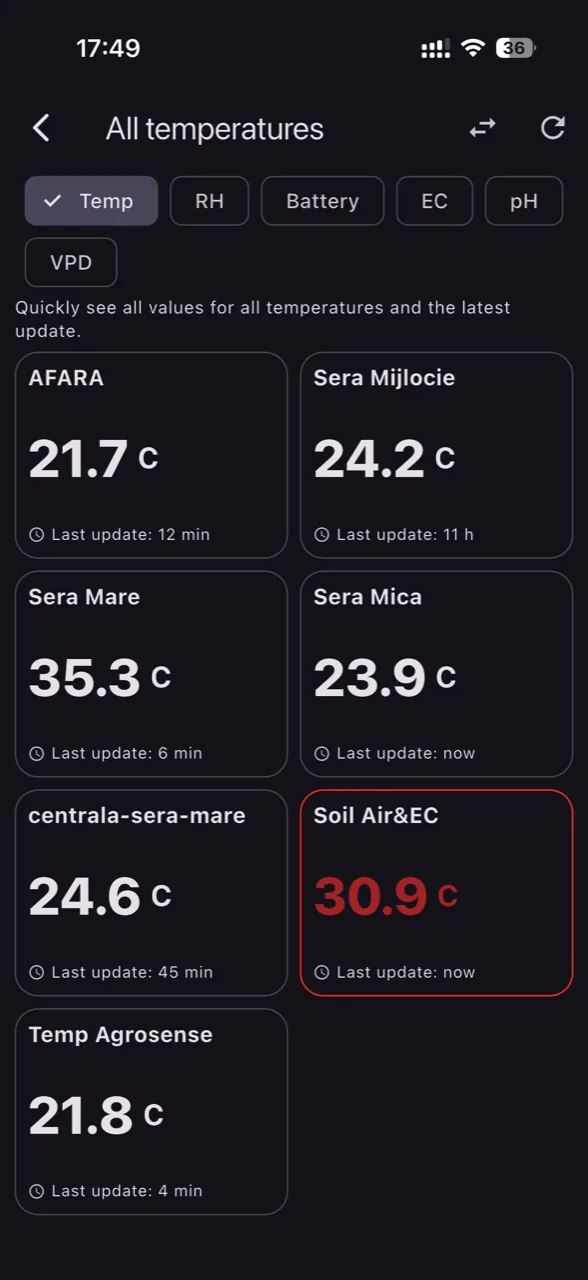
Each device only shows what it truly reports: air temperature and RH for atmospheric sensors, EC, pH, soil temperature, and soil moisture for root-zone probes.
GrowGuard brings sensors, forecast, AI-assisted alerts, sensor maps, crop intelligence, reports, and team workflows into one platform for modern horticulture. Monitor climate, soil, disease pressure, and crop status across greenhouses, flower production, vegetable crops, orchards, and vineyards from your phone, tablet, or desktop.
One operational flow
Live monitoring, sensor map, per-device alerts, forecast, Excel export, history, team access, and per-user menus.
This video shows how GrowGuard connects sensor data, timely alerts, and operational decisions for greenhouses, tunnels, orchards, vineyards, and high-value horticultural crops.
Inspired by the way professional growers think: connect every signal, keep the crop context visible, and react before climate, root-zone or disease pressure turns into avoidable loss.
Each device only shows what it truly reports: air temperature and RH for atmospheric sensors, EC, pH, soil temperature, and soil moisture for root-zone probes.
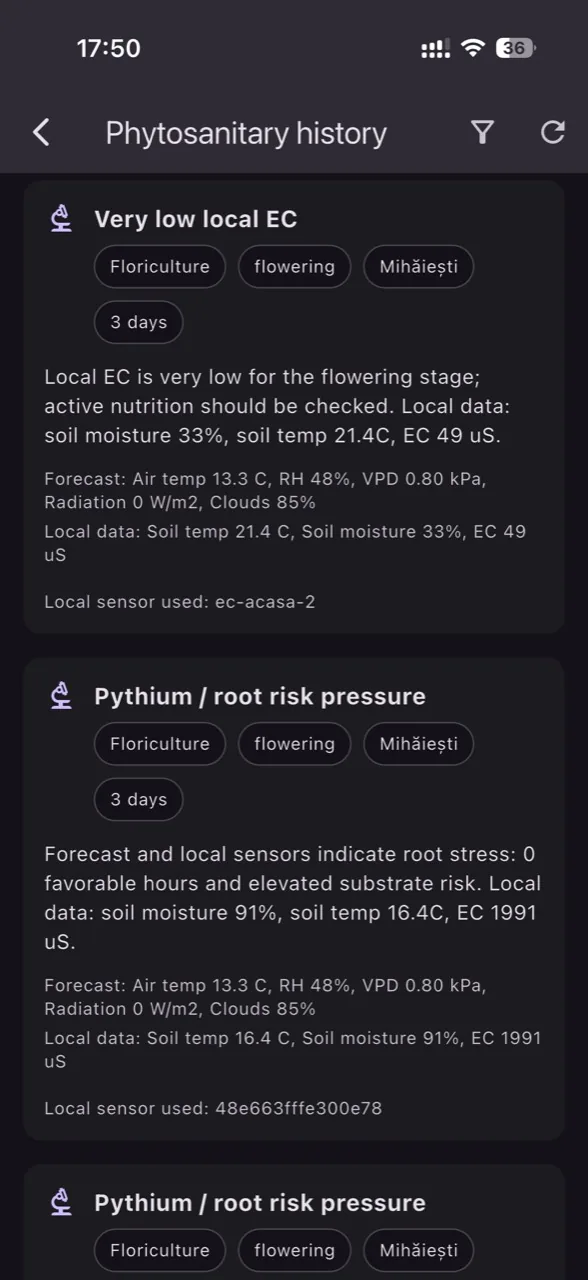
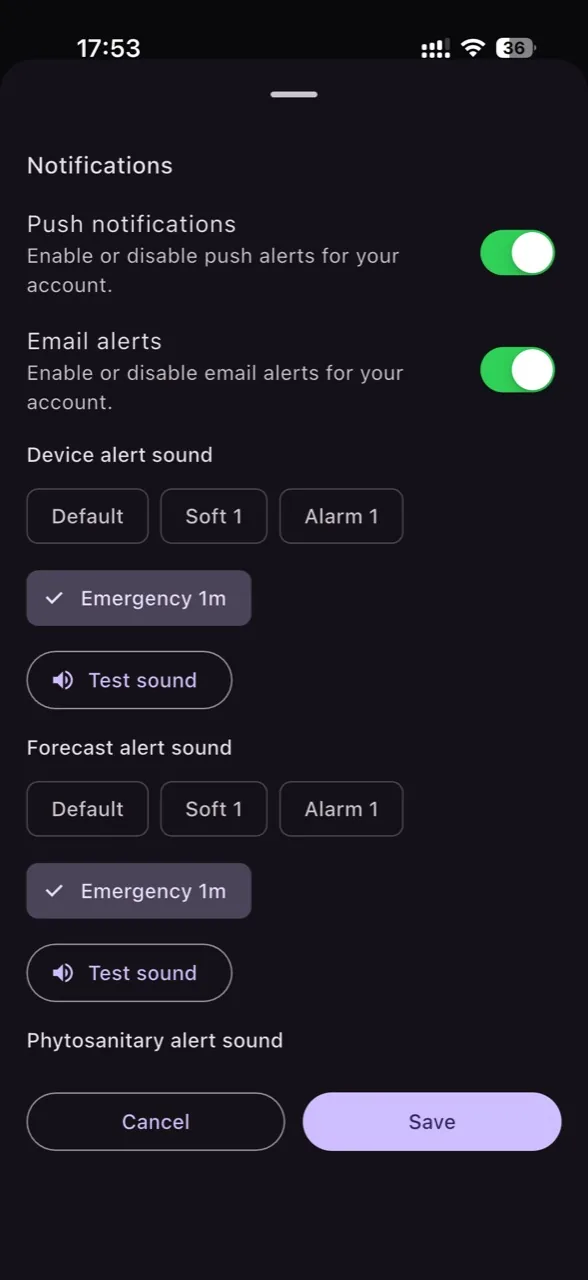
Device thresholds, phytosanitary events, and offline states can trigger notifications with custom sounds. For disease-risk alerts, AI can explain the contributing factors: forecast, humidity, temperature, crop profile, and local sensors.
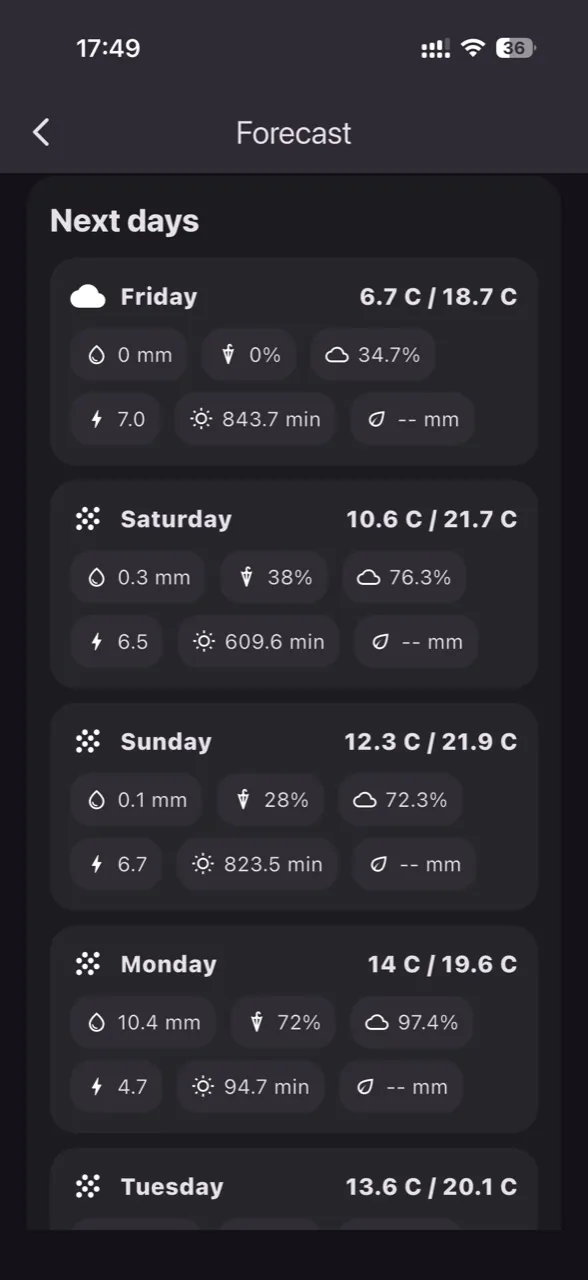
See temperature, cloud cover, humidity, and disease-relevant weather context for the next days directly inside the platform.
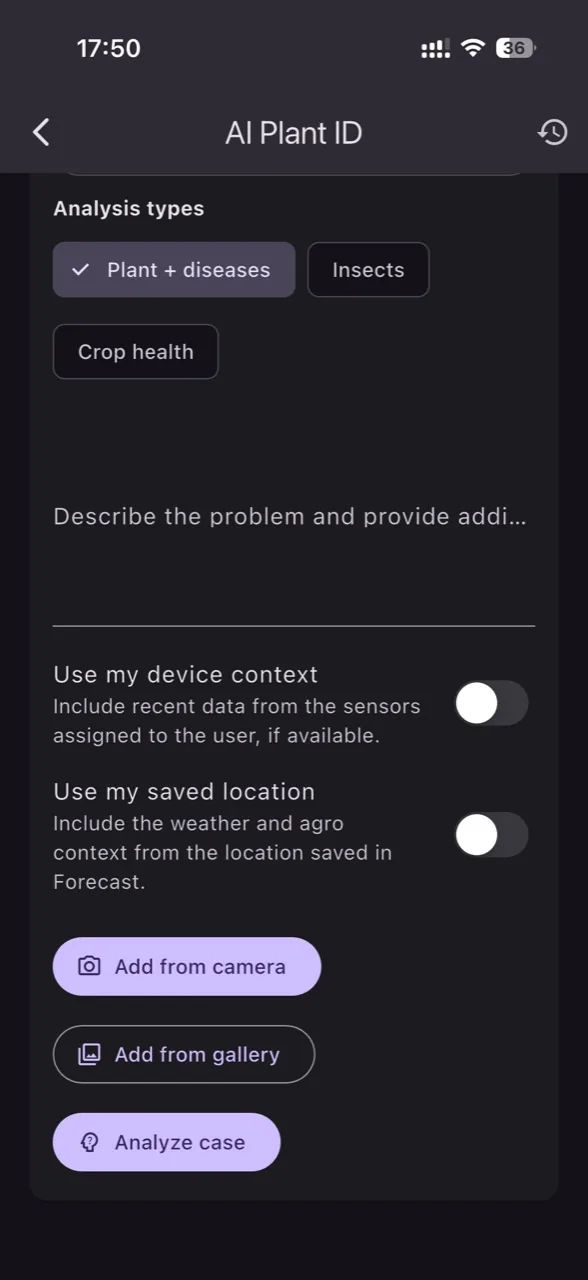
Users can submit images and notes, while AI Plant ID combines plant, insect, and crop-health identification with local context and history into clearer guidance for diseases, pests, stress, or nutrition problems. For phytosanitary alerts, AI translates risk into operational language without replacing specialists or product labels.
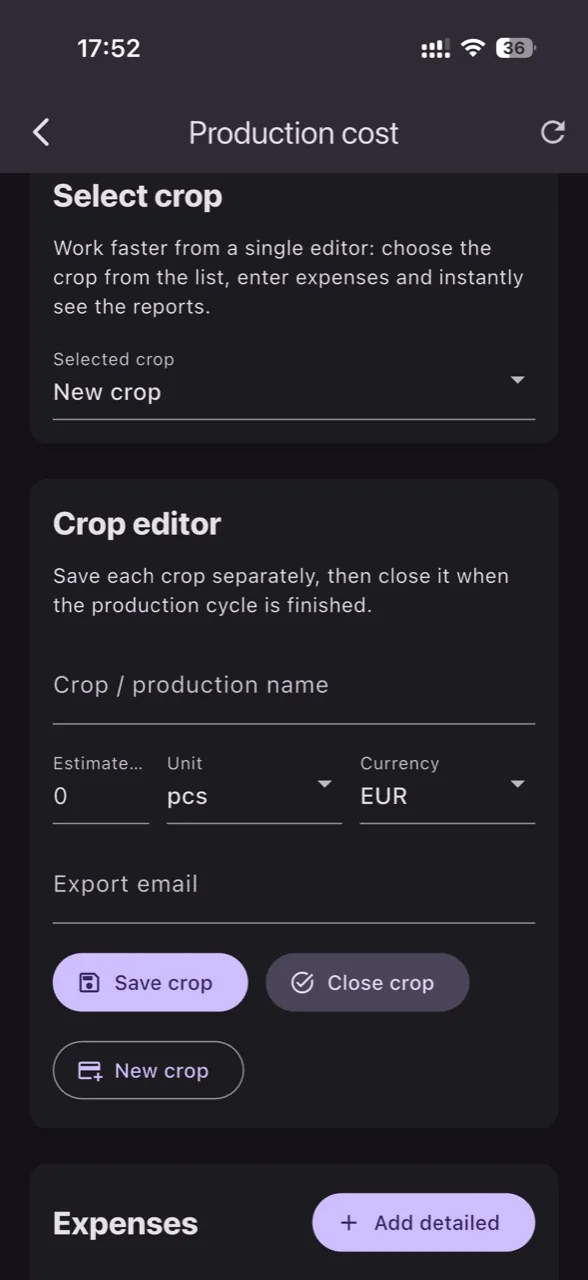
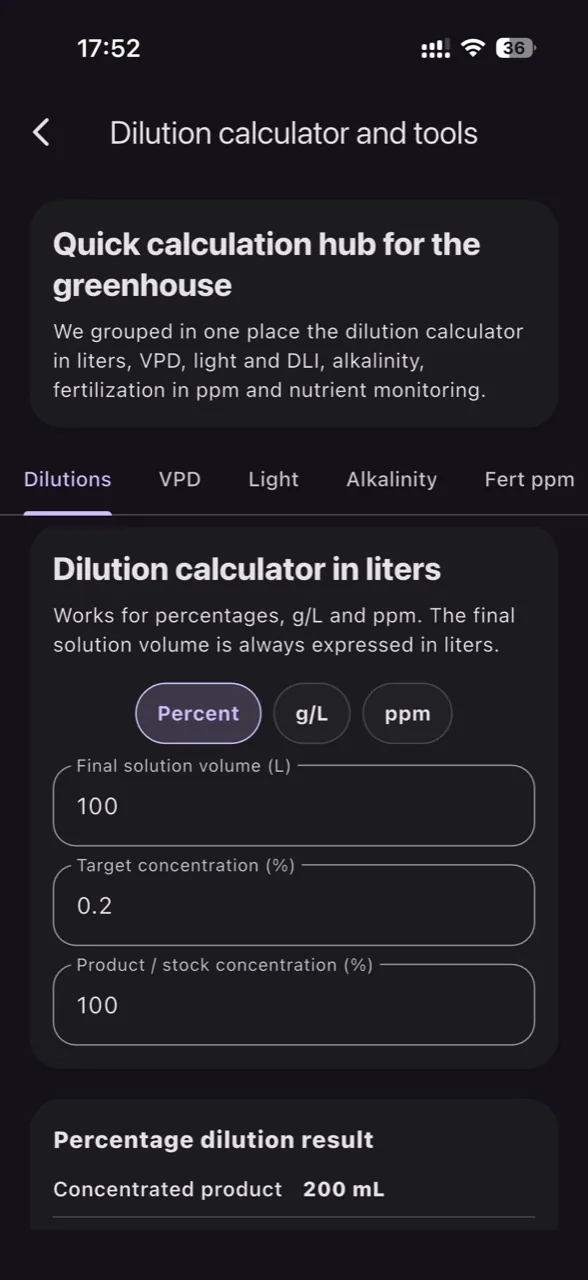
Track multiple crops in parallel, add categorized expenses, see cost per unit, sales, and profit, then send the Excel report directly by email. The dilution module complements daily greenhouse operations, while the VPD, light, DLI, alkalinity, fertilizer, and nutritional monitoring tools stay in the same workspace.
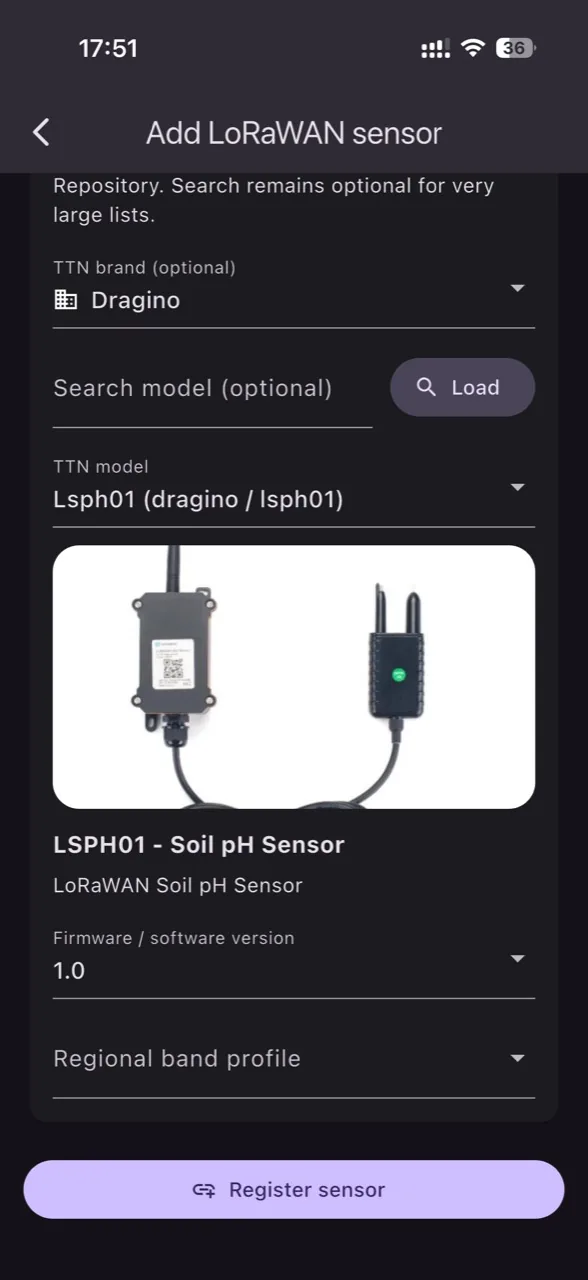
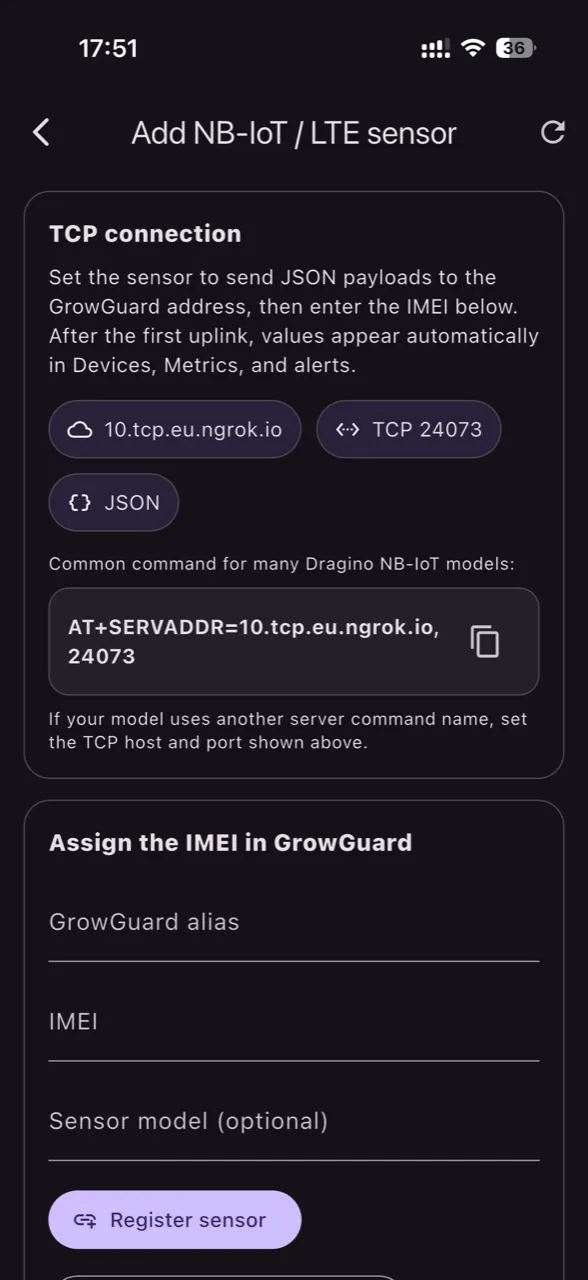
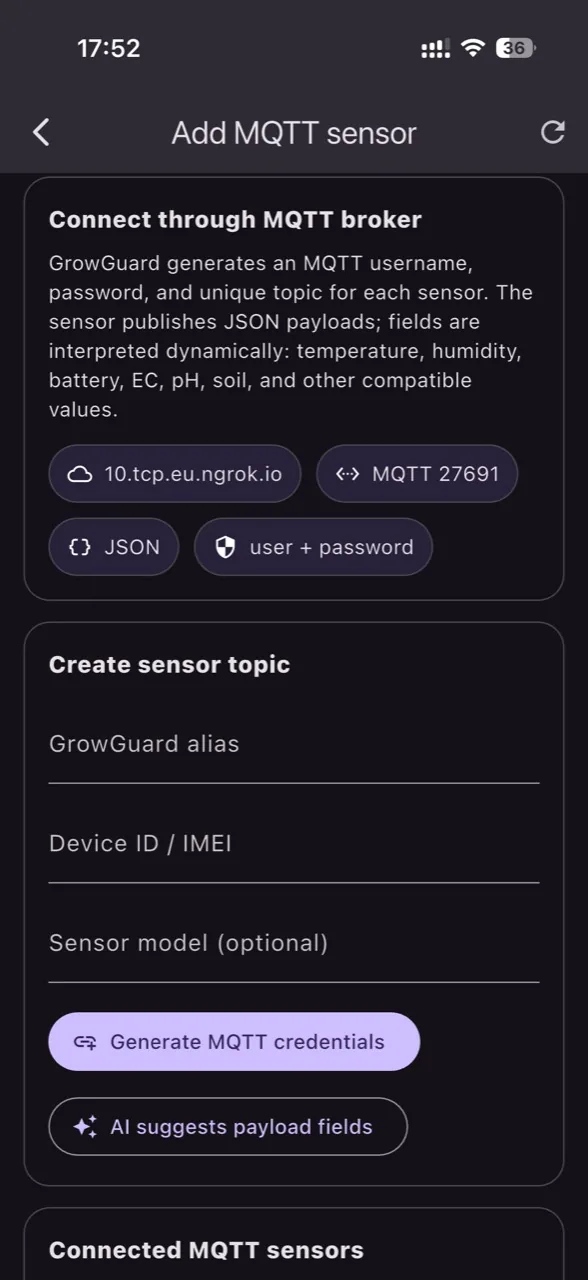
Invite colleagues, choose which devices each user can see, register any TTN-compatible LoRaWAN sensor directly from the app, add Helium-compatible sensors through MeteoScientific, or connect an existing TTN application by API and import the active devices into GrowGuard. For NB-IoT/LTE sensors, the user enters the IMEI and points the device to the GrowGuard TCP endpoint. For MQTT, GrowGuard generates a unique topic with a safety token, then interprets JSON payloads dynamically. For new models, AI can propose mappings for temperature, humidity, battery, EC, pH, or soil fields, only after user validation.
See sensors on a map, switch between standard and satellite layers, and save a device position only when the user explicitly chooses it. Phone location is not tracked continuously and is not used for advertising.
Administrators can leave each user with exactly the workflows they need: subscription, team, map, forecast, AI Plant ID, LoRaWAN/Helium/NB-IoT/MQTT sensors, orders, calculators, export, or specialty information.
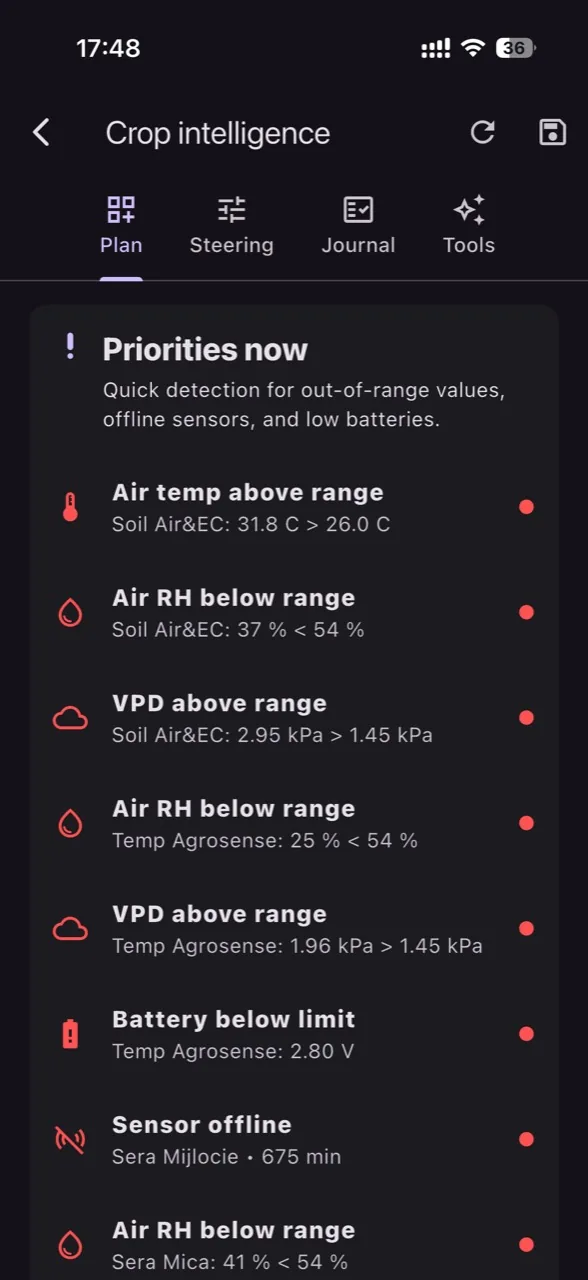
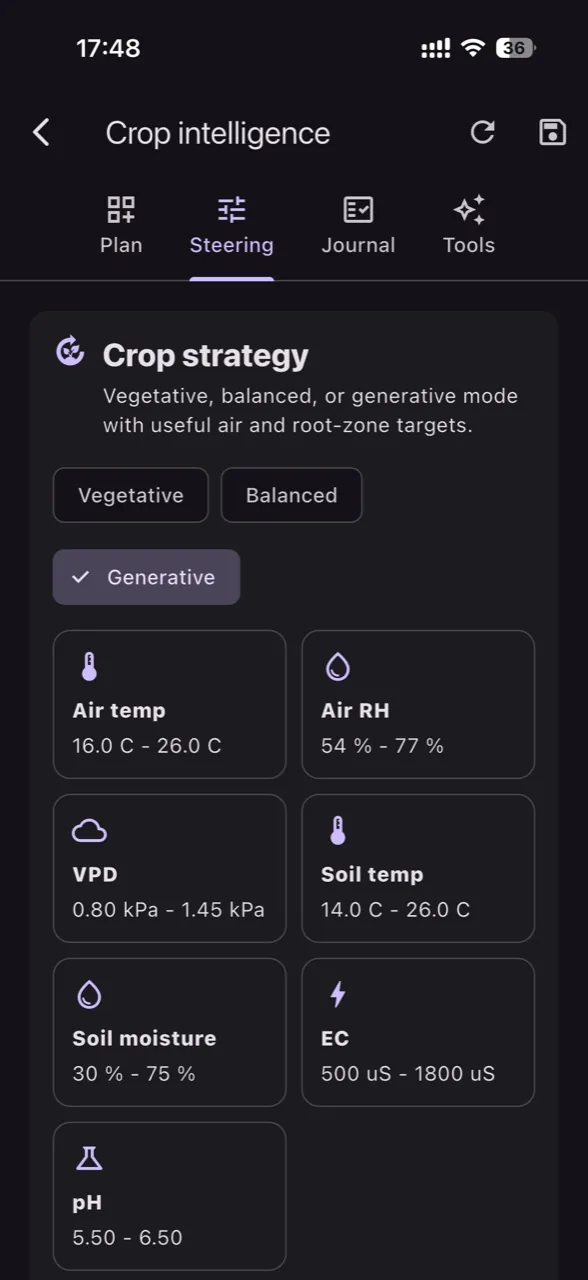
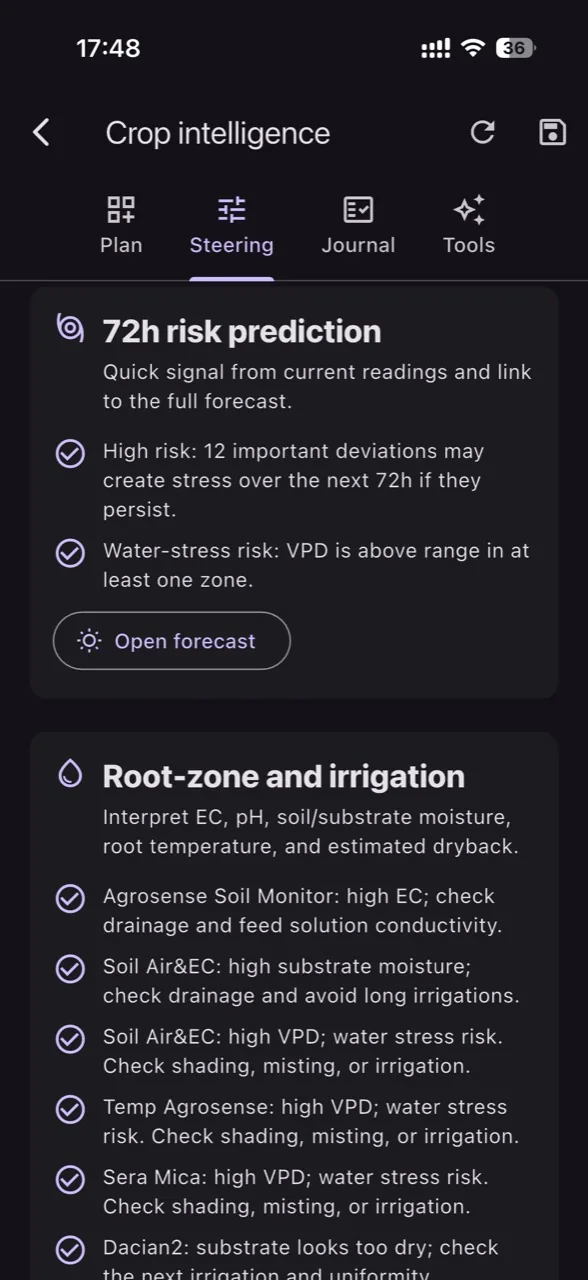
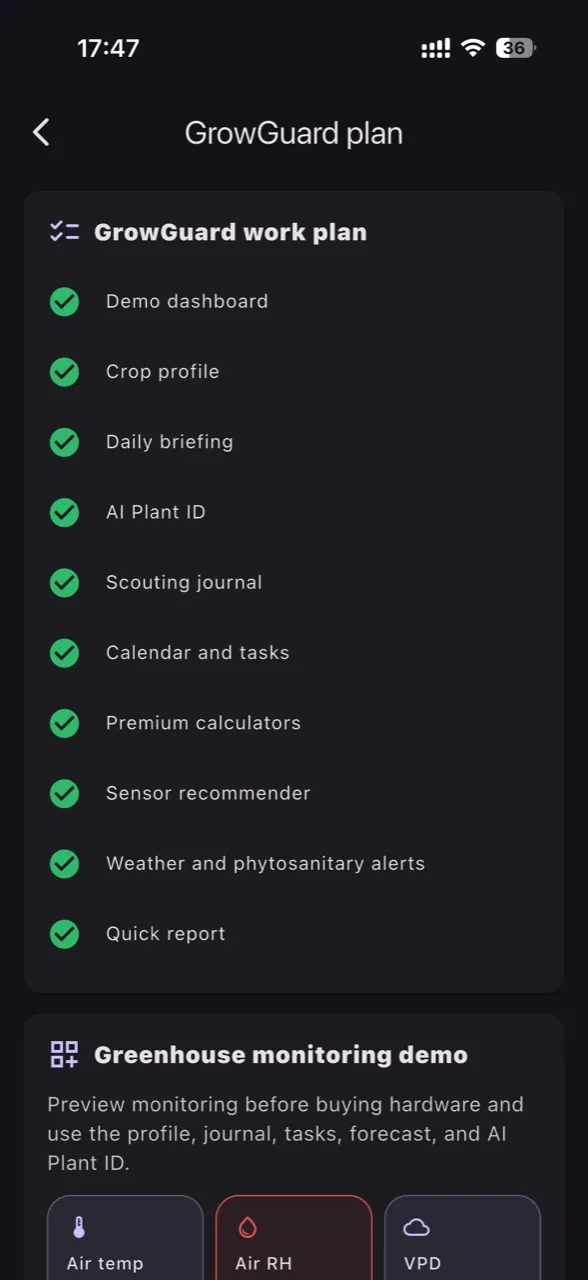
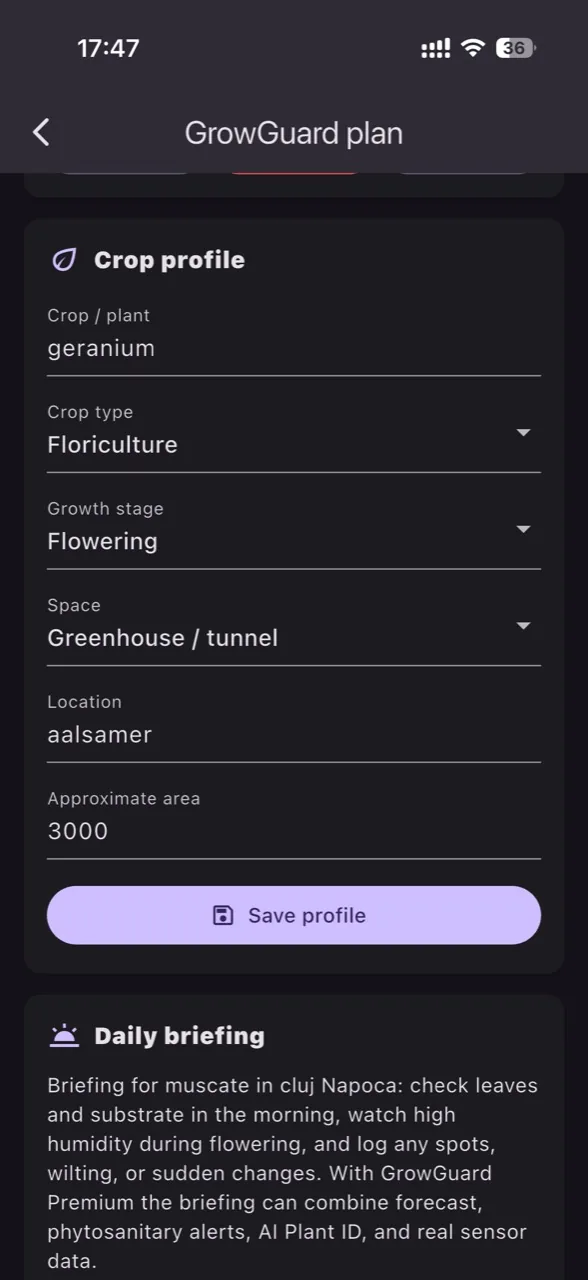
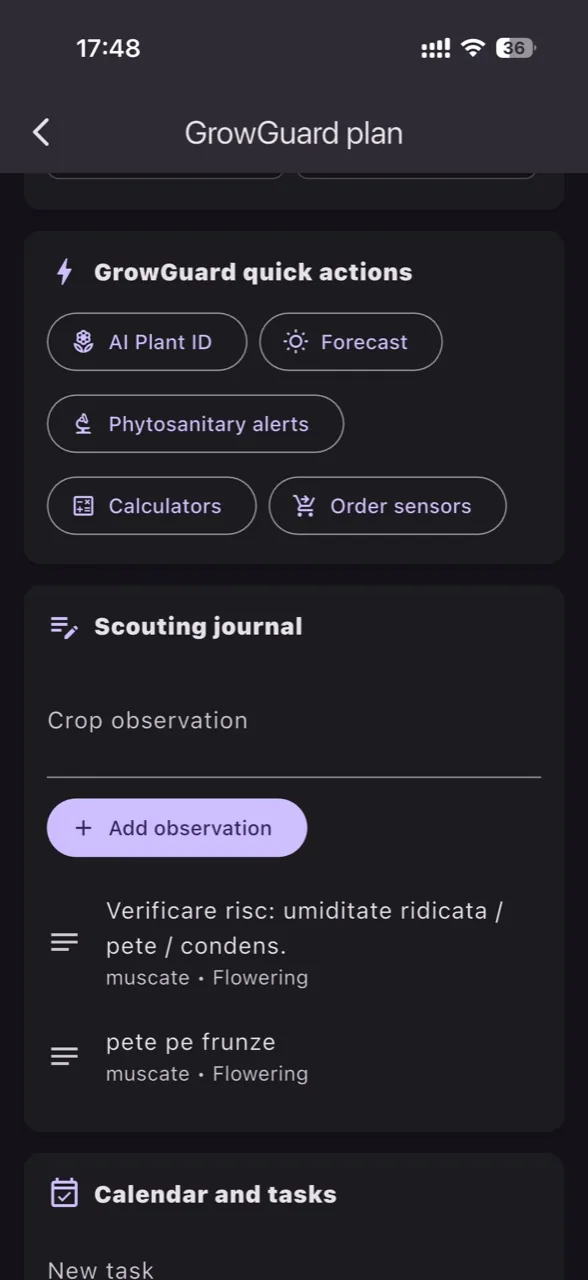
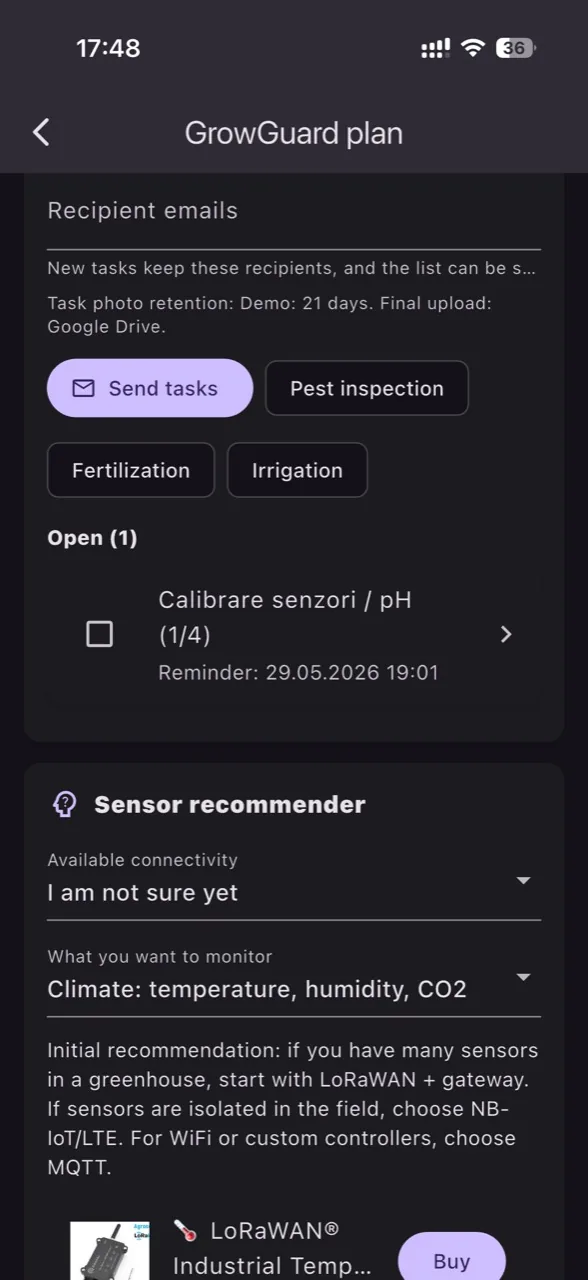
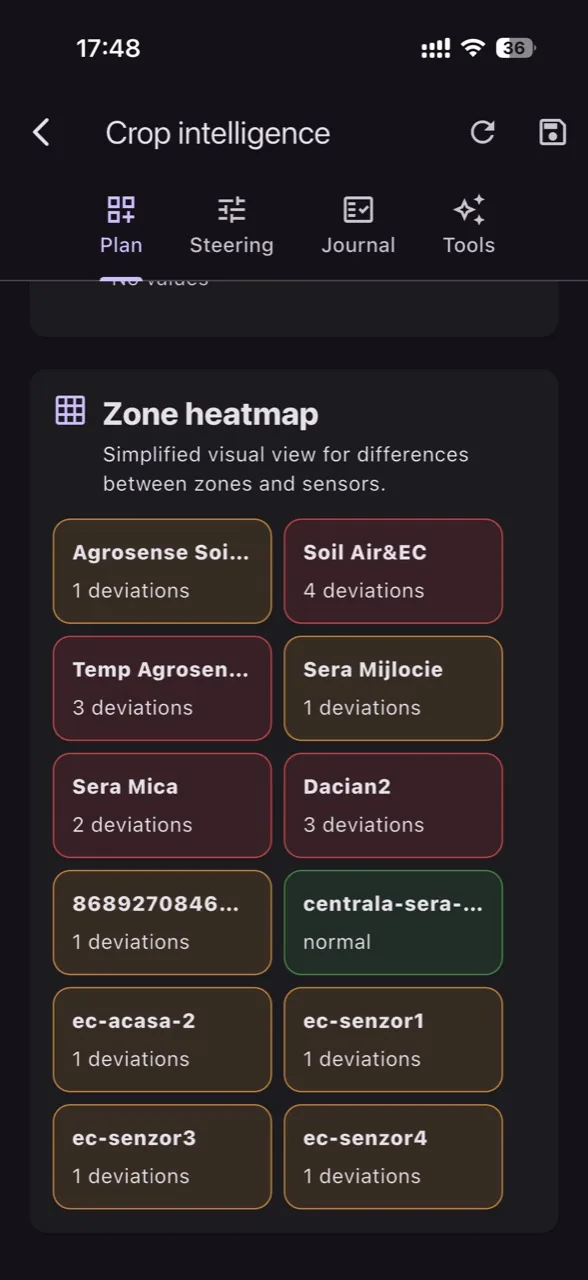
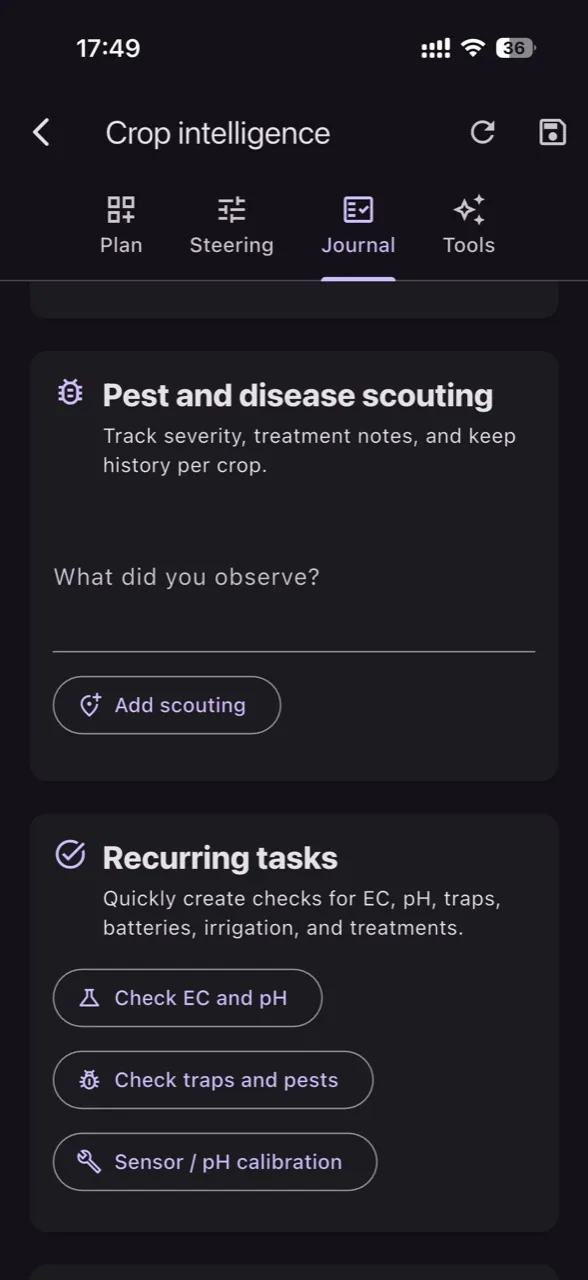
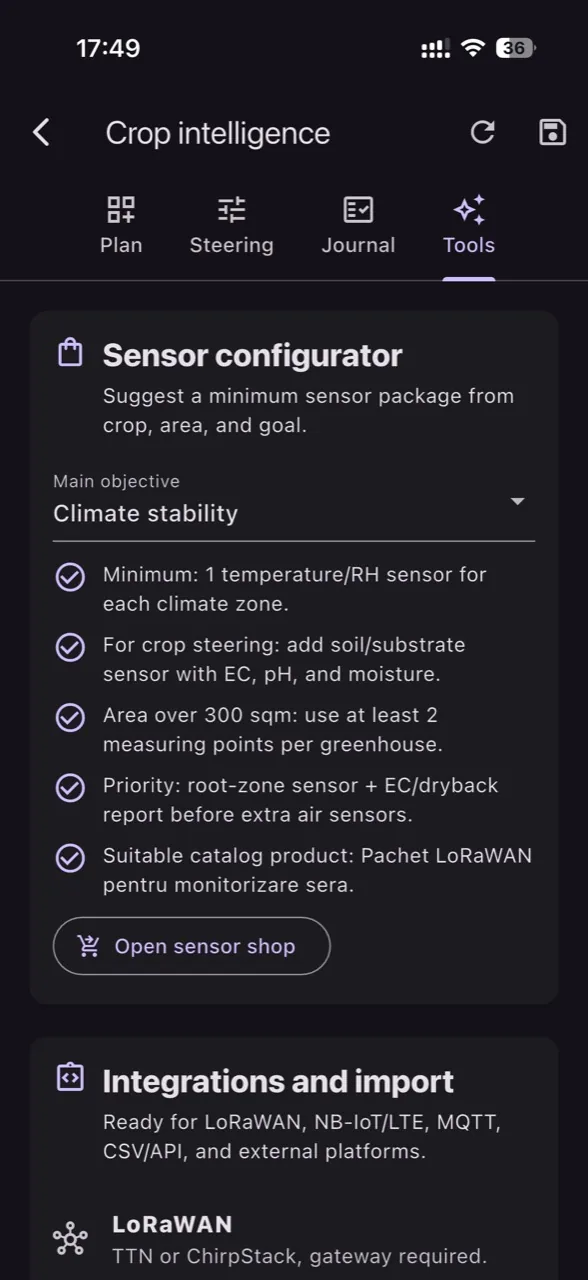
Build the crop plan, choose the goal, review deviations against useful ranges, get GrowGuard AI recommendations, log scouting notes, create recurring or team tasks, assign them to teammates with deadlines, trigger notifications, and export an Excel table with owner, assignee, comments, and Google Drive photo links. Demo works partially without sensors; Premium adds live LoRaWAN, Helium, NB-IoT, and MQTT readings to the recommendations.
The sensor map, crop intelligence, AI Plant ID, AI-explained phytosanitary alerts, and payload mapping add operational context on top of raw field data.
The campaign should speak to real horticulture workflows: protected crops, flower production, vegetables, orchards, vineyards, and teams that need fast decisions from live data.
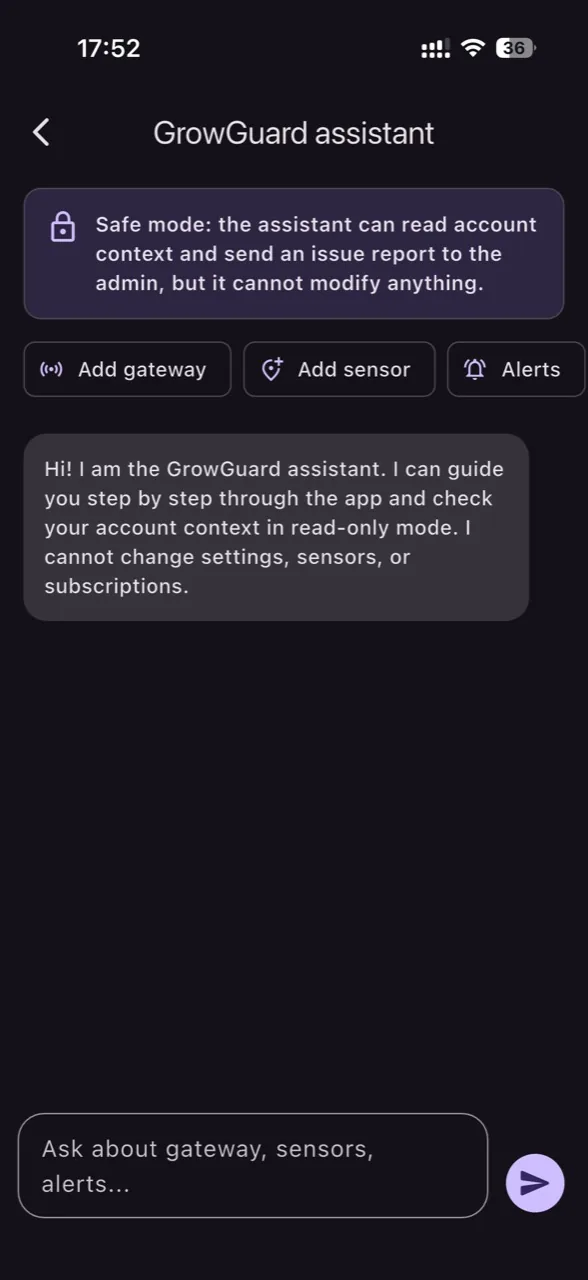
Visitors should understand the practical use: GrowGuard applies AI where it saves time and removes ambiguity. Disease-risk alerts get explanations, and sensor payloads can receive proposed mappings, always with human validation.
GrowGuard already models floriculture, vegetable crops, orchards, and vineyards differently so forecast, local sensors, and AI explanations for alerts can stay grounded in reality.
Supports Botrytis pressure, powdery mildew, root-zone stress, high humidity periods, and greenhouse microclimate stability.
Tracks downy mildew risk, fungal pressure, forecast windows, and the root environment that drives fertigation decisions.
Gives context for scab, fire blight, monilinia, and the humidity and drying cycles that matter in tree crops.
Supports grape downy mildew, powdery mildew, Botrytis on clusters, and weather-sensitive vineyard monitoring.
The Android, iOS, and web experience was designed for daily work: live dashboard, device detail, sensor map, charts, forecast, alerts, export, and administration.
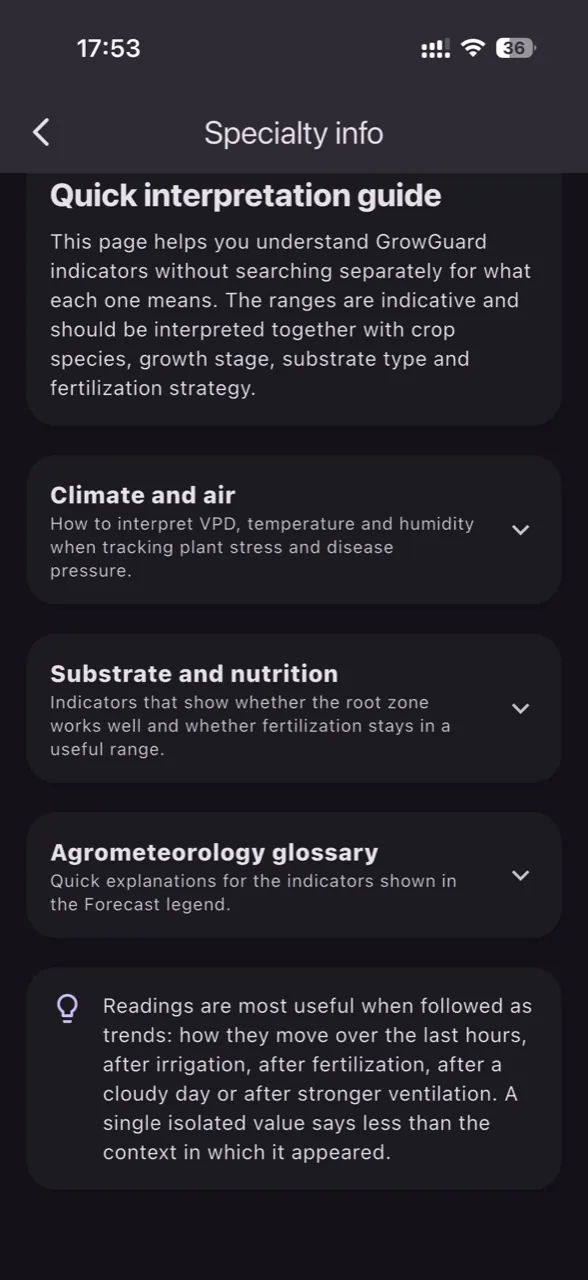
Every image below comes from the live GrowGuard product: device detail, forecast, Excel export, notifications, interpretation guides, phytosanitary modelling, and operational AI flows.
Start with a demo, then configure the sensors, services, and plans that fit your greenhouse, orchard, vineyard, or crop monitoring project.