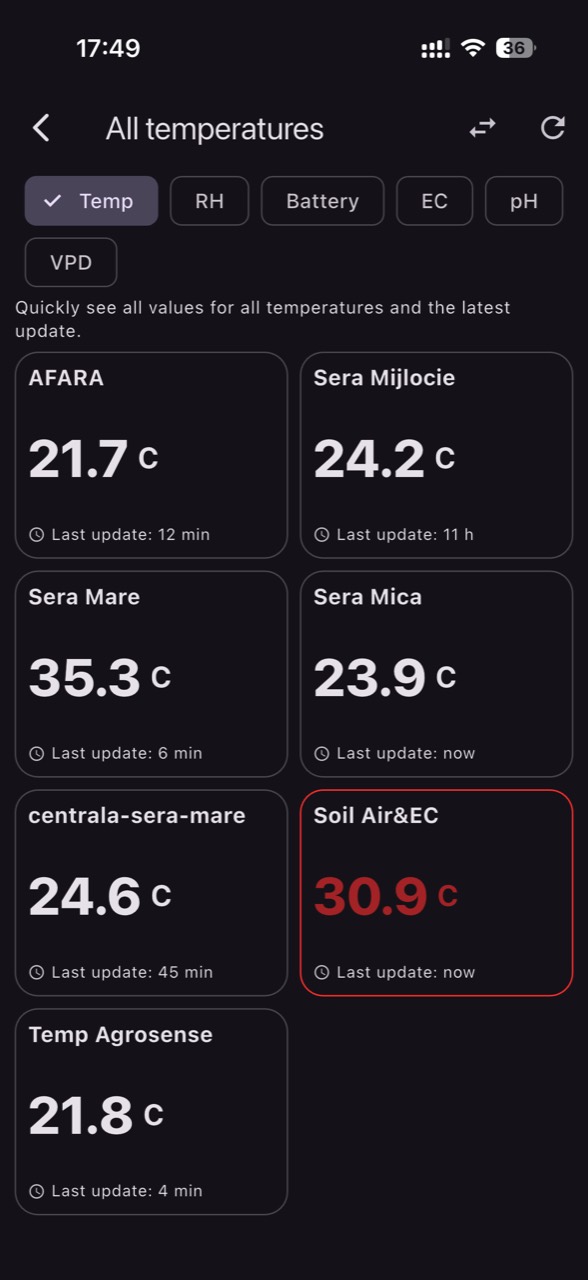
VPD (vapor pressure deficit) is a compact indicator of the “pull” the air can exert on water at the leaf surface. In a greenhouse or tunnel, the same air temperature can mean stress or comfort depending on relative humidity. That’s why VPD thresholds often outperform separate temperature or RH alarms—but only when they are set and filtered correctly.
The practical problem is that VPD reacts fast to short events: a passing cloud, a door opening, a gust of wind, a fogging/overhead mist cycle, or a heating flow change. If alerts trigger on every fluctuation, the team starts ignoring them. The goal is to cut noise without missing the events that truly require action.
Below is a commissioning workflow: which sensors and placements make sense for VPD, how to independently verify that values are real, how to define zone- and time-window thresholds, and how to validate that ventilation, shading and watering produced the expected effect. Examples are hypothetical; final thresholds must be adapted to your crop and constraints.
1) What VPD controls in the plant—and why it matters for production
Transpiration depends on the difference between how much water vapor the air could hold at its temperature and how much it actually holds (RH). When VPD is high, the air “pulls” water from the leaf; stomata may close, photosynthesis can drop, and some vegetables and flowers can show scorched tips or deformities. When VPD is low, transpiration slows: xylem flow and the movement of calcium and other nutrients can be limited, and leaves can stay wet longer.
What to observe: midday limp leaves even when the substrate is moist, sensitive growing points, film condensation, or abrupt day/night swings. What to verify independently: leaf temperature can differ from air temperature, and VPD calculated from air T/RH is an estimate; use direct crop inspection and track whether the plant returns to turgor and rhythm after an intervention. Practical decision: treat VPD as a plant “demand” indicator, not a universal setpoint. Result check: compare before/after history—did VPD stabilize, and do symptoms lessen under similar light conditions?
2) The right sensors for VPD: what they measure—and what they don’t
VPD is calculated from air temperature and relative humidity at the same point. That means you need a combined T/RH sensor (or tightly co-located sensors) with good response to changes and appropriate protection from radiation and droplets. A sensor in direct sun will overestimate temperature and inflate VPD, creating false “stress” alerts even when the leaf may be cooler than the local air measurement suggests.
What to observe in data: short, repeated VPD spikes on clear days, or large differences between nearby sensors. What to verify independently: during commissioning, spot-check with a portable thermometer/psychrometer at the same location and moment; also confirm that RH rises sharply during fogging/overhead mist (it should show). Practical decision: if the microclimate is uneven, use multiple points by zone rather than one “truth.” Result check: after improving placement (shielding the sensor, moving away from nozzles), nuisance alerts drop while real events remain visible.
3) Placement and the “invisible microclimate”: why nuisance alarms happen
In a tunnel, the difference between the door end and the crop center can be large, and air can stratify: warmer and drier above, cooler and more humid below. If the sensor is too close to sun-warmed film, a fan, or a vent opening, you measure the equipment’s immediate effects more than the crop environment. For VPD, what matters is “the air the leaf experiences” at canopy height.
What to observe: alerts exactly when ventilation opens, with no stress signs in the crop; or low-VPD alerts right after overhead irrigation even though leaves dry quickly. What to verify independently: (hypothetically) note the time sidewalls opened, shade was pulled, or fogging started, and confirm the same signature appears in the data. Practical decision: move the sensor away from point sources and define separate zones when you have compartments. Result check: after relocation, VPD variations align better with plant condition and real operations.
4) Data freshness and units: you can’t get good VPD from unsuitable data
VPD is sensitive to fast changes, so sampling intervals and transmission delays matter. If data arrives infrequently or in “bursts,” an alert can appear after the event has ended. During commissioning, define what “near real-time” means for your operations: ventilation decisions may need minutes, irrigation sometimes tens of minutes, and shading depends on radiation and temperature dynamics.
What to observe: alerts that arrive too late to act on, or step-like graphs with coarse jumps. What to verify independently: compare the alert timestamp to a known action in the greenhouse (opened/closed) and measure the lag; check units (VPD is commonly expressed in kPa) and ensure temperature scales match across sources. Practical decision: where the sensor allows, increase reading frequency and add confirmation windows (persistence) so you don’t react to a one-minute peak. Result check: fewer “after the fact” alerts, and interventions align with the true timing of stress.
5) How to define thresholds: from physiology to operational constraints
There is no universal VPD threshold because response depends on species, stage (seedling vs fruiting), density, light, heating strategy, and irrigation approach. Instead of choosing a number “by hearsay,” start from symptoms and a goal: prevent midday wilting, maintain calcium transport, reduce night condensation, or stabilize growth. Then map the goal to actions you can execute consistently with your equipment and labor.
What to observe: when problems occur (hours, days with certain conditions), in which zones, and after which interventions. What to verify independently: correlate with root-zone moisture measurements and leaf observations; a high VPD with a dry substrate requires a different response than high VPD with adequate moisture. Practical decision: set different day/night and zone thresholds, plus an “early warning” threshold before an “action” threshold. Result check: over 1–2 weeks, see whether interventions become less frantic while plant uniformity improves.
6) Anti-nuisance filters: persistence, hysteresis, and correlations
Robust alerts don’t rely on a single transient crossing. Use three simple ideas: persistence (the condition must last), hysteresis (the return threshold differs from the trigger), and correlations (VPD together with temperature/RH behavior or a second sensor). For example, a 2–3 minute VPD peak after opening a door should not start a decision chain, while a 20–30 minute plateau may be operationally relevant.
What to observe: repeated on/off alerting in short intervals, or alerts that coincide with routine work (entries, spraying, washdowns). What to verify independently: confirm the alerting variable is supported by the others (temperature rising, RH falling), not just a single RH “jump.” Practical decision: implement “exceeds X for Y time” logic and separate thresholds for trigger and clear. In GrowGuard you can set VPD alerts by zone so they reflect real microclimates, reducing unnecessary trips. Result check: notification volume decreases while meaningful events still get caught.
7) Operational triggering: choosing ventilation, shading, or watering
The same VPD deviation can call for different actions. If VPD is high because temperature is high and air is dry, ventilation may lower temperature but also bring in even drier air, increasing VPD. Shading reduces radiative load and leaf temperature, often with a steadier effect. Watering (especially in the substrate) improves water availability for transpiration but does not directly reduce air VPD; fogging/overhead mist can reduce VPD but carries wet-leaf and disease-risk tradeoffs when used poorly.
What to observe: after ventilation, VPD may rise; after shading, VPD may fall; after watering, the plant may regain turgor without large VPD change. What to verify independently: check root-zone moisture with a dedicated probe (a temperature sensor does not measure substrate moisture), and visually confirm whether leaves remain wet too long after fogging. Practical decision: define a preferred response based on likely cause (heat load, dry incoming air, water deficit). Result check: use history to confirm VPD stabilizes after the intervention and that the crop doesn’t enter repeated stress cycles the same day.
8) A 7-step commissioning protocol and post-event audit
Step 1: define your real zones (ends, center, near walls, compartments). Step 2: mount T/RH sensors at canopy height, shielded from direct sun and water jets. Step 3: watch 24–48 hours for plausibility and whether zone differences make agronomic sense. Step 4: do a targeted independent spot-check with a portable instrument. Step 5: create warning and action alerts with persistence and hysteresis. Step 6: (hypothetically) test one controlled intervention (for example a planned vent opening) and confirm its signature in data. Step 7: keep a simple log of what was done and when.
What to observe in the audit: whether alerts coincide with known actions and whether the intended effect appears within 10–30 minutes (depending on volume and equipment). What to verify independently: when an alert looks “odd,” go to the greenhouse and check one simple thing—is the sensor wet, is a door open, is sun hitting it, did fogging start, or is it a real air change? Practical decision: adjust threshold, duration, or placement—don’t just disable the alert. In GrowGuard, use zone history to compare before/after and reduce nuisance trips. Result check: after 1–2 tuning cycles, alerts become predictable and useful to the team.
Conclusion
Good VPD thresholds are not “magic numbers” but a system: correctly chosen and placed sensors, sufficiently fresh data, zone-based thresholds, and filters that require persistence. On top of that, every alert must be tied to an executable decision and a check of the effect—otherwise it becomes noise. Done consistently, VPD becomes a crop-stabilization tool, not a notification generator.
If you want to commission VPD alerts without nuisance trips, start with a short commissioning and post-event audit cycle, then tune gradually. In GrowGuard you can monitor VPD by zone and set alerts that reflect your real microclimate; for everything else, the key is method: observe, verify, act, and confirm the result.