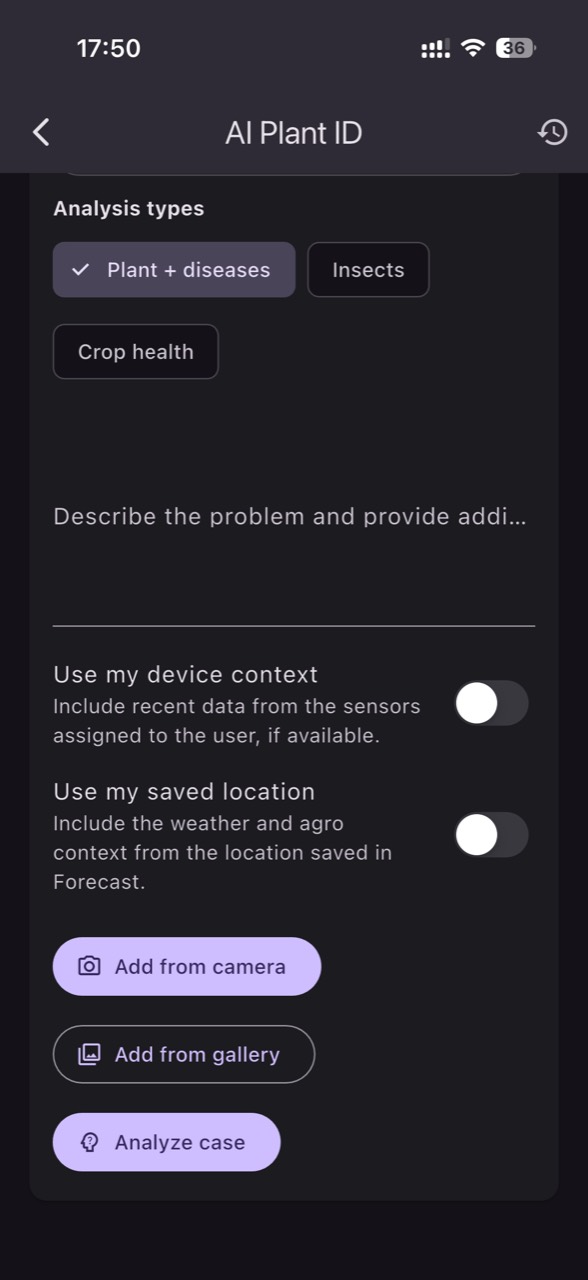
A plant photo captures symptoms; sensors capture the context that produces them. If you use only one source, you risk either treating a “picture” without a cause, or reacting to a number without looking at the plant. Together, images and field data become a maintenance tool: you confirm the measurement is correct and that your intervention truly changes the microclimate or the root-zone conditions.
In practice, most mismatches come from poor sensor placement and from the fact that farms have real microclimates: edge versus center, row end versus middle, near a door versus near a wall, beside a thermal curtain versus under a vent opening. That is why AI Plant ID is most useful when the photo is mentally “tagged” with its exact location and compared against a well-defined zone in the field.
The plan below proposes a seasonal maintenance and verification routine: what changes as the crop grows, how to independently check sensors (without trusting them blindly), what practical zone-level decisions you can make, and how to verify the result after 24 hours, one week, and after a weather event. Examples are explicitly hypothetical so you can adapt the protocol to your crop.
1) Start with a microclimate map, not a “leaf symptom”
Mechanism: a curled leaf, a burnt edge, or slow growth can have different causes, but microclimates often organize them on a map. Before taking any photo, mentally mark zones: tunnel ends, rows near the door, the shaded area, soil/substrate differences, irrigation sectors. Observe whether symptoms follow a spatial pattern: in patches, as a band, or only along edges.
Independent verification: walk a fixed route (same points, same time of day) and note light, airflow, puddling, drip uniformity, and vigor differences. Practical decision: choose 2–4 zones worth monitoring separately (not necessarily every row). How to check the result: once zones are defined, photos analyzed via AI Plant ID in GrowGuard become comparable because you know where they happened, not only what they show.
2) Sensor placement: what “representative” means as the crop grows
Mechanism: as biomass increases, the air inside the canopy becomes a different microclimate than “free” air. A temperature/RH sensor mounted too high will see a different dynamic than leaf level; one placed against a wall will read artificial influences. Observe vertical differences between the canopy top and interior, especially after irrigation or in the evening. In greenhouses and tunnels, airflow and screens can create layers.
Independent verification: do a commissioning round at the start of the season, then repeat when the canopy closes the row. Compare temporary measurements (a portable thermometer/hygrometer) next to the installed sensor to check plausibility. Practical decision: adjust the climate sensor height so it stays in the relevant zone (near leaf level) without direct contact with wet foliage. How to check the result: confirm that differences between zones remain consistent rather than chaotic.
3) Soil/substrate sensors: depth, position, and the root system’s “language”
Mechanism: roots do not use water from a single point; they use a volume. If a moisture probe is too close to a dripper, you will see sharp spikes; too far, you may see a false “drought.” In substrate crops, stratification develops fast: the top dries while the lower layer can remain wet. Observe where most active roots are at the current stage and whether irrigation creates uneven wetting fronts.
Independent verification: connect sensor trends with a simple check: a soil slice (or, hypothetically, a gravimetric check in substrate) and a root inspection at the edge of a block/pot. Practical decision: place the probe between two drippers or at a constant offset from the line, in the active root zone, and choose depths that capture both a “fast” layer and a reserve layer. How to check the result: after irrigation, the curve should rise and fall in a repeatable way.
4) EC and pH: same abbreviations, different media, different conclusions
Mechanism: EC and pH depend on what medium you measure and how. Source-water EC, fertigation-solution EC, substrate extract EC, and bulk-soil EC are not equivalent. EC does not tell you which ion is excessive, and pH alone does not tell you alkalinity. Observe whether symptoms (hypothetically chlorosis or tip burn) concentrate in zones with different moisture dynamics.
Independent verification: periodically use laboratory analysis for water and, when relevant, for substrate/soil; on-site pH/EC monitoring complements lab work, it does not replace it. Also verify units and measurement conditions: in-line versus sample, water versus drainage. Practical decision: if root-zone EC rises over time while photos show stress, adjust irrigation/fertigation management in small steps and follow the trend rather than a single value. How to check the result: look for trend stabilization and gradual recovery of vigor.
5) Photos as a repeatable diagnostic tool: a simple protocol
Mechanism: AI Plant ID can suggest likely categories (deficiencies, heat stress, phytotoxicity, pests), but photos are sensitive to light, angle, and growth stage. Observe differences between symptoms on young versus old leaves, distribution within the plant, and whether lesions are pinpoint (more compatible with pests) or margins are uniform (more compatible with stress). In dense canopies (tomato, pepper, cucumber), early signs may be hidden inside.
Independent verification: standardize capture: same distance, same side of the row, the same 2–3 “reference leaves,” plus one wide shot of the zone. Include a system photo (dripper, soil, mulch, netting) for context. Practical decision: when a zone looks “suspect,” photograph the same plant (or the same segment) 24–48 hours after your intervention. How to check the result: look for changes consistent with the mechanism (for example, reduced midday wilting after irrigation uniformity improves).
6) Comparing microclimates: how to avoid wrong conclusions
Mechanism: zone differences can come from a real microclimate or from the instrument (drift, shielding, battery, connectivity). Observe whether two zones diverge only at certain hours (for example early morning): that may be condensation/placement influence; if they differ consistently, a stable microclimate is more likely. VPD calculated from air temperature and RH is an estimate; leaf temperature can differ, especially under direct sun.
Independent verification: when you see an anomaly, first check plausibility: is the sensor data fresh, are there jumps or stuck values, can you confirm with a portable measurement and plant observation? Practical decision: compare zones in pairs—“control” (stable zone) versus “problem” (symptomatic zone)—not all at once. How to check the result: after adjustments (ventilation, shading, sealing), the gap between zones should shrink during the critical parts of the day.
7) Seasonal maintenance plan: what changes and what to check monthly
Mechanism: the season shifts risks. Spring: late frost and large day/night swings; summer: overheating, radiation, high evaporation; autumn: high humidity and condensation risk. Meanwhile, crop architecture changes—height, density, demand, vegetative/generative balance. Observe whether a zone becomes problematic exactly when the canopy closes; you may have “fallen behind” with sensor position or with water distribution uniformity.
Independent verification: monthly, do three checks: (1) physical integrity of sensors and cables, (2) trend consistency versus the “control” zone, (3) a practical field inspection (condensation, leaks, drip clogging). Practical decision: reposition or add a measurement point when new microclimates appear (for example after installing a shading net). How to check the result: track whether alerts decrease in frequency and increase in relevance.
8) After an intervention: proving you fixed the cause, not just “changed the graphs”
Mechanism: a good intervention has two signatures: it changes the measured condition and it changes the plant’s response. If only the graph looks calmer but photos show symptom progression, the cause may differ (for example, nutrition or root issues). Observe response times: air responds in minutes to hours; roots and leaves can respond in hours to days; visible growth shifts show in days to weeks.
Independent verification: define confirmation criteria ahead of time. Hypothetical example: after correcting a weak-irrigation zone, look for (a) moisture curves that no longer drop abruptly, (b) reduced wilting at peak hours, (c) more uniform size of new leaves. Practical decision: if only one criterion improves, do not “close the case”; keep checking and adjust the hypothesis. In GrowGuard, zone comparisons and history support this confirmation step.
Conclusion
The practical protocol is simple: define microclimates, commission sensor placement, photograph in a standardized way, then compare zones as you would in a field experiment. At each step, ask: what mechanism would explain both the data and the image? What can I verify independently, quickly, on site? What small decision can I take without locking the crop into an irreversible “treatment”?
Over the season, repeating these steps becomes maintenance: reposition sensors as the canopy changes, check zone differences after weather events, and validate interventions through trends plus repeated photos. If you want to structure this workflow in one place, GrowGuard can link AI Plant ID with zone-based data and microclimate comparisons—start with one “control” zone and build from there.