Tipburn (marginal leaf burn) in greenhouse lettuce and spinach is one of those problems that seems to “happen overnight”: leaves look fine in the morning, then by afternoon the edges turn scorched and necrotic, especially on the youngest inner leaves. In a greenhouse, the cause is rarely a single factor; it’s usually a mix of microclimate, growth rate, and how water actually moves through the plant.
At its core, tipburn is a local calcium imbalance in the fastest-growing tissues. Calcium moves mainly with the plant’s water flow, and inner leaves (poorly ventilated inside the rosette) can transpire less even while the plant is demanding water. That is where VPD, EC, and the way you irrigate by zones become tightly connected in practice.
A good protocol does not mean imposing “universal settings.” It means measuring correctly, comparing edge zones with the center, and independently verifying what sensors suggest. Below are concrete steps: the mechanism to watch, the indicators that matter, what you can cross-check with simple tools, the decision you can take, and how to validate that it truly reduced risk.
1) Understand the mechanism: where VPD and calcium meet in tipburn
Tipburn develops when a leaf expands quickly but its margins remain under-supplied with calcium. Calcium is not easily redistributed from older to younger leaves; it depends on xylem transport, which follows the water stream. When conditions increase water demand (high VPD) but inner leaves have limited transpiration (less air movement and light within the rosette), a local shortage forms exactly in the youngest tissue.
What to observe: tipburn often starts in the inner leaves of lettuce heads, and in spinach it can show on tips or margins after accelerated growth. What to verify independently: compare leaf temperature with air temperature (even with a simple IR thermometer, hypothetically) and note the hours when symptoms “switch on.” The practical decision is not simply “more water,” but stabilizing transpiration and growth rate via microclimate and salinity management. Check results on new leaves; damaged leaves rarely “recover.”
2) VPD in a greenhouse: a useful indicator, but an estimate sensitive to microclimates
VPD is calculated from air temperature and relative humidity; it describes how strongly the air can pull water vapor from plant surfaces. In dense lettuce/spinach stands, the leaf-level microclimate can differ from readings taken at 1.5–2 meters: leaves may be cooler (due to transpiration) and the air between plants more humid. That’s why a single VPD point can hide risk on specific benches, bays, or edges.
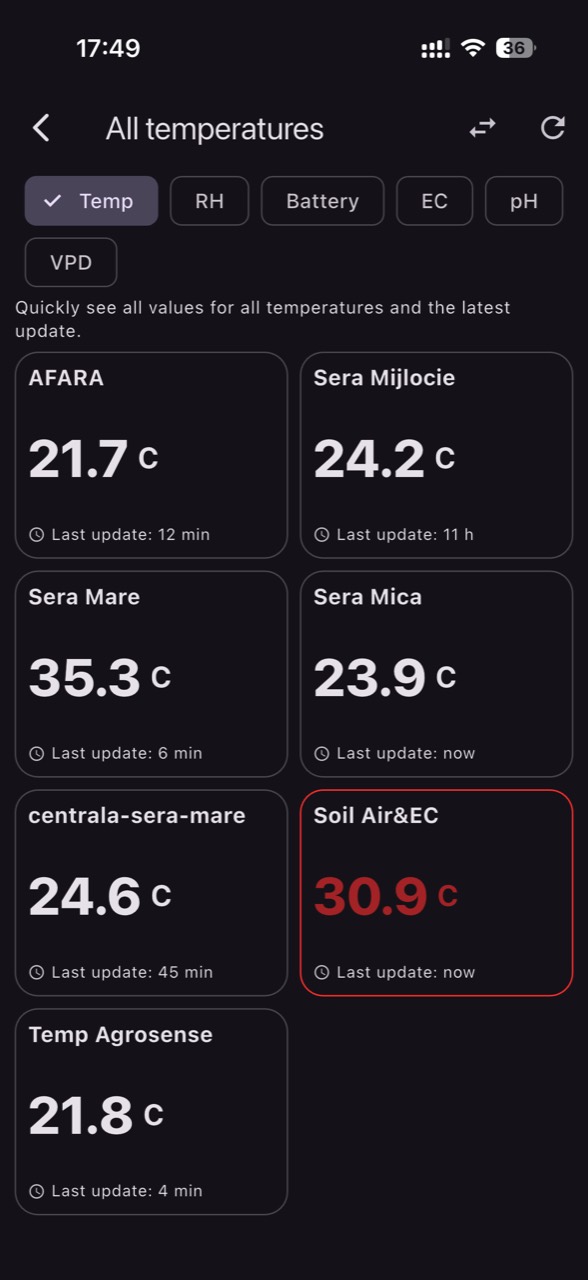
What to observe: after vent openings, heating events, or gusty outside conditions, VPD can spike abruptly; conversely very low VPD can coincide with condensation and wet leaves, which also slows transpiration. What to verify independently: look for differences between edges (near doors, sidewalls, gables) and the greenhouse center, and between leaf height and near the floor. The decision is to set zone-specific VPD alerts rather than one global threshold, then check the effect by comparing the same time window “before vs after.” In GrowGuard, the zone map helps you avoid treating the greenhouse as a single uniform volume.
3) EC: what you measured, in which medium, and why wrong comparisons worsen tipburn
EC (electrical conductivity) indicates soluble salts; it does not identify individual nutrients. In a greenhouse, the measurement medium matters: the EC of source water, fertigation solution, drain water, and a substrate/soil extract are different measurements and cannot be compared directly. If EC rises in the root zone, water uptake becomes harder even when the substrate looks moist, and calcium delivery to young leaves becomes even less reliable.
What to observe: tipburn that intensifies when you “feed harder,” or after a period of strong evaporation (often more pronounced along edges). What to verify independently: measure EC separately in source water and in the applied nutrient solution using a portable meter, and for the root zone use a consistent method (for example, drain or substrate extract) and record the method in your log. This aligns with established water-analysis practice: on-site pH/EC monitoring complements laboratory analysis rather than replacing it, and each sample type has its own interpretation. The decision: if root-zone EC appears high, first confirm the measurement (units, temperature compensation, calibration) and only then adjust irrigation/fertigation. Validate by stabilizing EC in the same sample type—not by mixing numbers from different media.
4) Irrigation and calcium: uniformity, rhythm, and transpiration “peaks”
In lettuce and spinach, the effective root zone is relatively shallow and plants respond quickly to wet–dry swings. If irrigation arrives in “waves” (long gaps followed by large events), the crop can experience osmotic stress cycles: uptake is restricted first, then growth surges when conditions become favorable again. Tipburn is frequently associated with these accelerations: new tissue forms faster than calcium can be delivered to expanding margins.
What to observe: more fragile inner leaves, marginal scorch after bright days with drier air, or after abrupt irrigation corrections. What to verify independently: use a simple field control—tray or pot weight (in substrate systems), checking moisture at active root depth, or a basic infiltration check in soil-based houses. The decision is to move toward finer pulses, but only after confirming distribution uniformity along the bed or bench. Check results by tracking whether root-zone moisture swings become smaller and whether new leaves form without necrosis; at the same time, verify you are not increasing wet-leaf duration (a separate plant-health risk).
5) Zone-based irrigation: when the same recipe causes tipburn only at the edges
In greenhouses, tipburn often appears unevenly: rows near doors, sidewalls, and end bays experience different air movement, radiation, and sometimes different actual water delivery (pressure differences, line lengths, partially clogged emitters). If you apply the same irrigation duration everywhere, faster-drying zones will experience a higher “felt” VPD and a more unstable water stream, even if a center sensor looks perfect. This is where true zone-based irrigation tends to have the biggest practical impact.
What to observe: smaller plants or paler color in one zone, or the opposite—vigorous plants with tipburn at the top, suggesting growth is too fast for calcium supply. What to verify independently: run a hypothetical uniformity test one morning—place identical containers under emitters at 6–10 points and compare volumes after a short irrigation; you don’t need a lab to catch large differences. The decision is to split the house into real zones (edge vs center, end vs middle) and give each zone its own thresholds and notes; in GrowGuard that means reviewing charts by zone, not averages. Validate by seeing volume differences shrink and post-irrigation moisture gaps between zones narrow.
6) Sensor choice and placement: what must be measured at “leaf level”
For tipburn, air sensors must represent the air the leaf actually experiences—not air next to a wall or high near the roof. A temperature/RH sensor mounted too high can underestimate humidity in the canopy and produce a calculated VPD that doesn’t reflect rosette stress. Similarly, soil/substrate moisture and EC probes must sit in the active root volume, not in a spot that stays permanently wet or permanently dry and misrepresents what most roots face.
What to observe: “correct-looking” charts while symptoms develop somewhere else. What to verify independently: temporarily (hypothetically, for 24–48 hours) move an air sensor closer to canopy height and compare; if the difference is systematic, it’s not “error,” it’s microclimate. For EC/pH, remember the basics: a temperature sensor does not measure EC or pH; those require dedicated probes and a clear definition of the medium (solution, drain, extract). The decision is to define at least two air points (edge/center) and at least one root-zone point in each critical zone. Validate when alerts align with the hours and locations where symptoms appear—meaning you’re measuring the driver, not a flattering average.
7) Intervention protocol: linking VPD, EC and irrigation without chasing numbers
A robust protocol starts with diagnosis, not settings. Step 1: identify the zone and time window when tipburn worsens. Step 2: check whether VPD spikes sharply or drops too low (condensation) and whether root-zone moisture is oscillating. Step 3: check EC in the relevant medium; a high value in drain or extract suggests osmotic stress even if the substrate looks wet. Only then adjust: either smooth variability (more frequent, smaller irrigations) or reduce salt accumulation (via a verified fertigation strategy adjustment).
What to observe after changes: the crop looks “calmer” when new leaves expand without burn, even if older leaves remain marked. What to verify independently: do a cross-check with a control day—same hours, same EC sampling method, same zone. The decision is to change one thing at a time (for example, only irrigation frequency in an edge zone) so you can attribute outcomes. In GrowGuard, use history to compare periods, but treat VPD as an estimate: if the leaf is cooler than the air, the leaf’s effective VPD can differ from the calculated value. Confirm success when fluctuations decrease and symptoms on newly formed leaves become less frequent.
8) Typical failure cases: stale data, wrong units, and “perfect EC” in the wrong place
A common reason tipburn persists is that decisions are based on data that are not fresh or not comparable. If a moisture sensor reports infrequently or its battery is near depletion, you may see a false “flatline,” and irrigation can be delayed during the most critical hours. With EC, unit confusion or comparing source water directly to drain water can lead you to conclude “everything is fine” while salts have accumulated at the roots. Likewise, a VPD calculated from a shaded point does not represent a sunlit strip near the sidewall.
What to observe: symptoms despite “perfect graphs,” or sharp differences between adjacent rows. What to verify independently: check the timestamp of the last transmission and take a spot manual reading (temperature/RH, EC with a handheld meter) to validate the sensor. The decision is to adopt a short seasonal commissioning routine—probe calibration, a response test (wet the zone slightly and see if the curve changes), and clear labeling of the EC medium (water, solution, drain, extract). Validate by seeing fewer chart anomalies and more repeatable decisions across short crop cycles, which is essential in leafy greens.
Conclusion
Tipburn in lettuce and spinach is not solved by a single setting because it is not a single phenomenon: it’s the intersection of microclimate (VPD), actual water availability in the root zone, and salinity/EC that can limit uptake. When you measure correctly by zone and compare like with like (same medium, same unit, same placement), you start seeing the patterns that precede symptoms—not only the damage after it appears.
The practical approach is: identify vulnerable zones, place sensors where the leaf lives and where the roots work, smooth oscillations through zone-based irrigation, and verify EC in the correct medium before making corrections. If you want to organize these zone comparisons and receive coherent risk-condition alerts, you can do that in GrowGuard; use the platform as a verification tool, not a substitute for crop observation.