In greenhouse roses, Botrytis risk is not only a “high humidity” problem. It sits at the intersection of water management (when and how much you irrigate), microclimate (how fast leaves and buds dry), and nutrition (how concentrated the solution is and how it affects tissue). When you connect these factors using data, risk windows become shorter and more predictable.
One complication is that a greenhouse contains microclimates. On the same day, one end can stay cooler and wetter while another dries quickly. Botrytis benefits from these differences, especially in areas with stagnant air, dense foliage, or near cold walls. That is why zone-based thinking matters more than a greenhouse-wide average.
EC and pH are also frequently misread because measurement media get mixed up: source water, fertigation solution, drainage, and substrate extract are not the same measurement. And sensors do not confirm that a pathogen is present; they only show conditions that can be favorable. A useful protocol combines measurement, independent verification, a practical decision, and a check of the result.
1) Why Botrytis links to irrigation, not just greenhouse air
Botrytis needs susceptible tissue and periods of moisture on plant surfaces (petals, sepals, leaves, and plant debris). Irrigation can raise air humidity through evaporation, slow leaf drying by keeping the canopy too humid, and create colder pockets when cooler water is introduced. In roses, tight buds and dense blooms trap moisture, while overlapping leaves reduce air movement and create persistent wet micro-sites.
What you observe in practice: flare-ups after cooling nights, after late irrigations, or after sudden temperature shifts. What to verify independently: walk the cold spots (near walls, corners, under gutters), check for condensation on structures, and see whether leaves remain wet early in the day. The decision: adjust irrigation timing to avoid “loading” the air with water vapor before the coldest period and improve drying uniformity. Check the result: the duration of high-humidity intervals drops in the same zones—not only the greenhouse average.
2) Relative humidity, VPD, and condensation: what they measure and what they miss in roses
Relative humidity indicates how close the air is to saturation, but it does not directly tell you whether a leaf is wet. VPD calculated from air temperature and relative humidity is an estimate of drying power; the leaf can be cooler than the air (at night or near cold surfaces), increasing condensation risk on tissues without an obvious change in average readings. Roses are vulnerable because petals create small pockets of humid air inside the flower.
What to observe: nighttime humidity peaks, rapid temperature drops, and clear differences between zones. What to verify independently: note mornings when you actually see a fine water film on leaves/petals or local “fogging” in a corner. The decision: treat RH/VPD as a risk-window indicator for scouting and microclimate actions (ventilation/heating/air mixing), not as a diagnosis. Check the result: in the problem zone, time spent near saturation becomes shorter and morning drying is faster.
3) EC and pH: the real connection to susceptibility and canopy microclimate
EC reflects dissolved salts in the measured medium, not “how much food” in a simple sense, while pH affects nutrient availability and solution stability. In roses, osmotic stress from overly concentrated solutions or large swings can shift growth toward tougher tissues or, at other times, fragile growth—both increasing sensitivity to injury and colonization. Salts can also alter water uptake and transpiration, indirectly changing humidity inside the canopy.
What to observe: inconsistent stem quality, softer foliage or marginal scorch on new growth, and periods of reduced transpiration. What to verify independently: clarify which EC/pH you are measuring (source water, fertigation solution, drainage, substrate extract) and confirm water quality periodically with laboratory analysis, because on-site monitoring complements rather than replaces lab testing. The decision: separate alerts by medium (for example, solution EC versus drainage EC) and track stability rather than chasing a single “ideal” number. Check the result: sharp oscillations reduce and plant response after irrigation becomes more consistent.
4) Leaf wetting by irrigation and “irrigation geometry”: drip, drainage, and a humid canopy
Many rose greenhouses use drip irrigation, so foliage is not wetted directly, yet irrigation can still feed canopy humidity via evaporation from the substrate/soil and from excessive drainage. Long, infrequent irrigations can drive stronger warming/cooling cycles in the root zone, pushing the plant between stress and saturation. Very short, overly frequent irrigations can maintain a constant vapor source and reduce drying intervals, especially where air circulation is weak.
What to observe: areas where leaves feel “heavy” in the morning or where symptoms appear after a series of late-day irrigations. What to verify independently: irrigation uniformity (are some lines partially clogged?), flow distribution, and whether there is ponding or disproportionate drainage. The decision: adjust duration/frequency to create clear periods for re-oxygenation and surface drying, without pushing the greenhouse into high humidity toward evening. Check the result: root-zone moisture curves and air humidity no longer rise together repeatedly after irrigations.
5) Zone sensors: what to choose and where to place them so they don’t mislead you
To connect irrigation with risk, you need distinct measurements: air temperature and relative humidity (for RH/VPD) plus dedicated EC/pH probes in solution or in the root-zone medium, depending on your system. A temperature sensor does not measure EC/pH; those require specific electrodes/probes and a maintenance routine. In roses, differences between rows, heights, and greenhouse ends can be large enough that a single point becomes falsely reassuring.
What to observe: “perfect values” at one point while problems repeat in another zone. What to verify independently: compare a fixed sensor with a handheld instrument on the same sample at the same temperature, and verify units (for example, EC in mS/cm). The decision: define real zones (cool end, center, near doors/fans, near walls) and mount sensors at canopy height, protected from direct air jets and direct radiation. Check the result: between-zone differences become explainable rather than chaotic, and alerts align with what you see in the crop.
6) Commissioning in GrowGuard: are the data fresh, and how to avoid thresholds that sabotage you
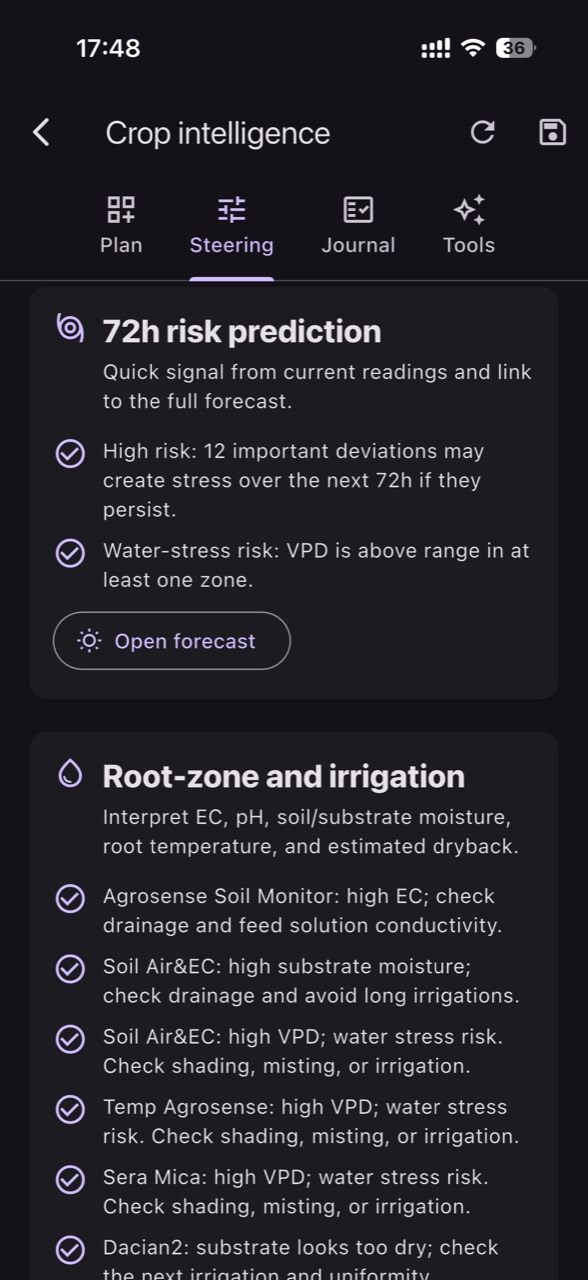
In any monitoring system, the first practical question is whether data are fresh enough for decisions. A Botrytis risk window can develop overnight; with transmission delays or missing periods, you will react to yesterday’s history. In GrowGuard, work by zones: do not follow only an average; verify that the critical zone reports consistently and that status alerts (battery/signal/sensor) are set so you do not discover “blindness” exactly when you need the data.
What to observe: alerts arriving too late or graphs with gaps during the most sensitive period (night to early morning). What to verify independently: compare the displayed time of the last measurement with greenhouse reality, and confirm that units and the measurement medium are correct (drainage EC versus solution EC). The decision: set “no data” alerts for critical zones and use thresholds that trigger on windows (time above a level) rather than brief spikes. Check the result: you receive timely signals for scouting/ventilation and reduce needless reactions to a few-minute peak.
7) A working mechanism: turning correlations (irrigation–EC/pH–humidity) into testable decisions
A robust approach is to treat each hypothesis as an operational test. Hypothetical example: you notice that after a late-afternoon irrigation, Zone A repeatedly moves into high humidity at night, and that in the same zone the drainage EC is higher than elsewhere. A plausible mechanism is that late irrigation increases vapor load while high EC reduces water uptake, lowering transpiration and keeping canopy air wetter. It is not certainty, but it is testable.
What to verify independently: confirm EC/pH with a correctly taken sample (and clearly label whether it is drainage or solution), inspect irrigation uniformity, and look for pathogen sources (plant debris, planting material, irrigation water), because conducive conditions do not automatically mean the pathogen is present. The decision: shift part of the irrigation volume earlier, correct the EC cause (for example mixing, injection, water quality), and improve air movement in Zone A. Check the result: over the next days, Zone A spends less time near saturation and the EC difference between zones narrows.
8) Common traps: when the numbers look “fine” but risk stays high
One trap is to “fix” humidity only by raising temperature without addressing vapor sources or cold zones; you can get warmer air and still have leaf condensation if the leaf remains cooler. Another trap is confusing EC measurements: EC of source water, fertigation solution EC, and drainage EC tell different stories; mixing them leads to wrong decisions. In roses there is also a canopy-density trap: leaves can dry very unevenly even if a sensor point seems acceptable.
What to observe: local symptoms despite an apparently acceptable average humidity. What to verify independently: check microclimate at flower level (not only high near the structure), look for condensation points on film/metal, and perform a hygiene inspection (debris, fallen leaves), because inoculum sources can keep pressure high. The decision: reposition sensors or add a point in the “suspect” zone, and during irrigation monitoring use drainage behavior as an operational indicator. Check the result: alerts begin to match observed reality and interventions become more targeted by zone.
Conclusion
The link between irrigation, EC/pH, and humidity becomes clearest when you measure by zones and treat data as a testing tool, not a verdict. In greenhouse roses, the practical goal is to shorten the periods when leaves and buds stay wet and to avoid swings that weaken the plant. Independent checks—correct sampling, condensation scouting, and irrigation-uniformity verification—prevent “optimizing” around the wrong hypothesis.
If you use GrowGuard, keep settings simple at first: clearly defined zones, sensors chosen for the right measurement medium, and alerts for risk windows and missing data. After any change, follow the result in the same zones over the next 24–72 hours to confirm you reduced the risk window rather than moving it elsewhere. If you want, request a short discussion to structure zones and verification steps for your greenhouse.