Gerbera is a crop where quality is lost “in the details”: petal spotting, gray mold on the flower head, weak peduncles, or blooms that no longer make grade. In many greenhouses, the trigger is not a single parameter, but the combination of irrigation, high humidity and too-low VPD, which extends drying time on leaves and flowers.
If you address only humidity (for example, by ventilating more) but continue irrigations that saturate the substrate or abruptly increase evaporation, you may just move the problem around: water stress during the day, condensation at night, and the Botrytis-favorable window remains. Conversely, if you only cut watering without tracking VPD, you can end up with “closed” leaves, low transpiration, and a humid microclimate right around the plant.
The protocol below focuses on practical cause-and-effect: which mechanisms connect irrigation to microclimate, what you must observe directly in the crop, what is worth verifying independently (beyond the sensor), what decision you make that day, and how you confirm it worked. At the end, you’ll also see how to set zone-based alerts in GrowGuard so the team acts where risk appears, not “across the whole greenhouse.”
1) Why gerbera can get Botrytis even when the air “seems fine”
Botrytis takes advantage of susceptible tissues and periods when surfaces remain wet or sit very close to the dew point. In gerbera, the flower head and the base of petals can hold moisture, and dense foliage creates a boundary layer with more humid air than the greenhouse “average.” Low VPD means slow evaporation; if irrigation raises local humidity, drying time extends even when sensor height readings look acceptable.
Intentionally observe where water film forms: underside of leaves, crown area, young flower heads, and spots with weak circulation. Verify independently: a focused inspection in the first 30–60 minutes after sunrise often tells more than a single RH value. The practical decision is not random “more ventilation,” but shortening periods of very low VPD and avoiding irrigations that push the root zone into saturation before night. Confirmation: faster complete drying in the morning and, in a hypothetical scenario, fewer lots with spotted blooms—especially in the same zones that used to flare up.
2) Irrigation as a microclimate generator: what happens after each watering
After irrigation, some water increases evaporation from the substrate and from leaves (via stomata), which can quickly raise local humidity and drop VPD. If the substrate stays very wet, plant water relations can also become unstable: roots have less oxygen, stress risk increases, and the canopy may behave unevenly during the day. In gerbera, uniformity is critical; “good” flowers and “soft” or weaker batches often separate on small differences in moisture in a pot/bed.
What to monitor: the shape of the substrate moisture curve (sharp spikes versus moderate rises), how long it stays elevated after watering, and whether nighttime shows a drift toward even higher moisture (often a sign of watering too late or too much). Verify independently by weighing a few reference pots or doing spot checks with a handheld meter; sensors show trends, but validation helps rule out placement errors. Decision: move some volume earlier and reduce late irrigations. Check the result by watching for lower night humidity and a more stable night VPD pattern.
3) Relative humidity vs VPD: why the same RH can mean different risk
Relative humidity alone does not tell you how quickly a surface can dry, because temperature changes everything. VPD (vapor pressure deficit) combines air temperature with RH to express the “pull” of the air for water vapor. For Botrytis, the practical issue is very low VPD—especially during transitions (evening/night/morning) when air cools and approaches dew point. In gerbera, flower heads sit close to leaf mass and can remain in a cooler, wetter microclimate than the general air.
What to watch: if, under the same heating/ventilation strategy, some zones sit at much lower VPD, those are where the earliest symptoms most often show up. Verify independently: VPD calculated from air temperature and RH is an estimate; leaf or flower temperature can be lower, increasing condensation risk even when the sensor value “doesn’t look alarming.” Decision: use VPD as a drying-rate and condensation-risk indicator, but confirm with direct checks for dew or water film. Result check: mornings where leaves dry sooner and, in a hypothetical example, fewer recurring “hot spots” of Botrytis in the same problem zones.
4) Condensation: the problem that starts with dew point, not with a fungicide
Condensation forms when a surface is colder than the humid air around it, causing vapor to deposit as liquid water. In greenhouses this often happens at day’s end: substrate and plants cool, RH rises, and temperature differences between zones (near walls, under structural elements, at bay ends) create dew pockets. Botrytis does not need rain; a thin film plus time can be enough. Late irrigation or poor drainage raises vapor supply exactly before the critical hours.
What to track: hours over recent weeks when VPD stayed very low, and whether those periods match the timing of petal or flower-head spotting. Verify independently with targeted inspections 2–3 hours after lights-out or just before sunrise where access allows. Practical decision: reduce humidity sources before night (late irrigation, standing water, leaks) and pair this with a climate strategy that avoids abrupt cooling of the plant mass. Confirm by seeing fewer wet surfaces in the same time windows and fewer grading rejections in sensitive batches.
5) Sensors you need to link watering to risk (and what they do NOT measure)
To connect irrigation–humidity–VPD, you need air measurements (temperature and RH, from which VPD is estimated) and root-zone measurements (substrate/soil moisture). If you fertigate, EC and pH require dedicated probes and you must specify the measurement medium: irrigation water, nutrient solution, substrate extract, or bulk-soil EC are different measurements and cannot be “directly compared.” A temperature sensor tells you nothing about EC/pH, and VPD calculations do not detect a pathogen or confirm a diagnosis.
Commissioning checks: confirm units (°C, %RH, VPD typically expressed in kPa; substrate moisture in volumetric % or another sensor-specific unit), reading frequency, and data freshness (stale data can drive wrong decisions in short risk windows). Verify independently: compare temperature/RH at two nearby points to catch bad mounting (direct airflow, too close to fogging/humidification, or in the line of heating). Decision: before changing irrigation recipes, ensure the sensors “see” the same air the crop experiences. Confirmation: once unexplained zone differences disappear after placement correction, climate and irrigation actions become more predictable.
6) Daily working protocol: linking irrigation to VPD and leaf condition
Instead of starting from a fixed irrigation template, start from three daily questions: (1) how fast does the canopy dry after morning start-up, (2) what happens to VPD during transition hours, and (3) what is the substrate moisture rhythm between irrigations. In gerbera, aim for a healthy alternation between sufficient moisture for growth and periods when the surface layer does not stay continuously wet; otherwise the canopy microclimate remains “loaded” with moisture.
Observe directly: leaf turgor in the warm part of the day, peduncle rigidity, and uniformity across rows. Verify independently: drainage and water removal, plus zones with non-uniform dripping or puddling—because a mechanical issue can look “like Botrytis” by keeping humidity persistently high. A practical (hypothetical) decision: if VPD repeatedly collapses in the evening, pull an afternoon irrigation earlier and split volume into smaller pulses so the substrate is steadier before night. Confirm by reduced RH spikes after irrigation and less morning leaf-wetness time.
7) Inoculum sources and hygiene: why good microclimate is not enough
Even with less favorable microclimate, Botrytis can persist when sources remain: plant debris, old flowers, dead leaves, planting material, or even water that introduces or maintains biological load. Microclimate tells you when conditions are conducive; it does not confirm the pathogen is present or that a symptom is definitely Botrytis. In a greenhouse, a zone that accumulates waste plant material can have higher pressure at the same VPD than a clean zone.
What to observe: whether first symptoms repeatedly appear near aisles, corners, mixing stations, or storage points for plant material. Verify independently with a hygiene walk-through: collect and remove debris, clean persistently wet areas, and check water quality (laboratory analysis remains the reference; on-site pH/EC monitoring complements it, not replaces it). Decision: treat hygiene as an inoculum-reduction intervention running in parallel with VPD control. Confirmation: in a hypothetical example, if after 2–3 weeks outbreaks stop starting from the same points, you’ve validated that source pressure mattered.
8) Zone alerts: turning data into fast, checkable interventions
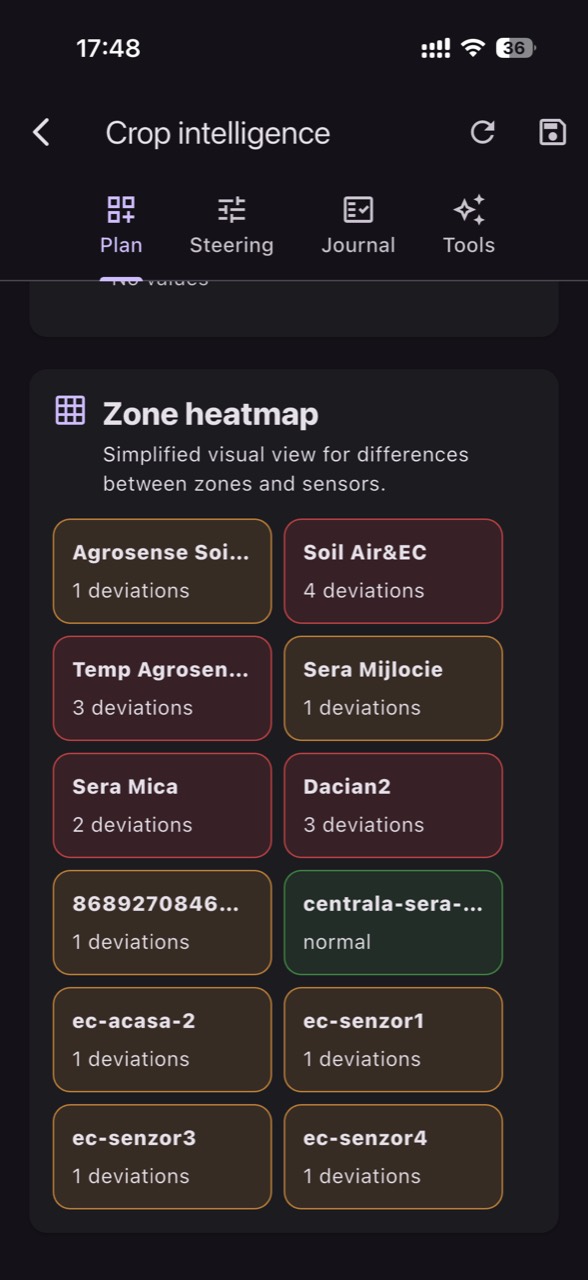
Useful alerts are not the ones that trigger often; they are the ones that tell you exactly where and when a risk window forms. In practice, greenhouse zones differ: bay ends, near walls, shaded rows, sectors with different plant density, or areas served by different heating lines. In GrowGuard, define zones that match these real differences and track temperature/RH (for estimated VPD) separately from substrate moisture, so you can see whether risk is driven by climate, irrigation, or both.
Before enabling alerts, verify that sensors deliver recent, comparable data across zones (a transmission delay or weak battery can create “ghost alarms”). Decision: set thresholds and trigger durations from your own history and on-crop observations, not from universal values—for example, alerts for “very low VPD for too long” in evening/night windows and alerts for “substrate too wet for too long” where saturation lingers. Confirmation: after a few episodes, record the intervention and check whether, on similar days, the risk window shortens in that same zone. That is the practical measure of a good alert.
Conclusion
In gerbera, quality loss rarely improves from a single change. Gains come from linking irrigation to microclimate: avoiding pulses that raise humidity before night, using VPD as a drying indicator (while remembering the leaf can be cooler than the air), and repeatedly verifying whether condensation is actually present in the crop. In parallel, reduce inoculum sources through hygiene, water checks, and debris removal—because “conducive conditions” are not the same as a confirmed diagnosis.
If you manage multiple bays or have strong end-to-middle differences, zone-based work shortens the time to a correct decision. With zone alerts in GrowGuard, you can convert low-VPD episodes and overly wet substrate patterns into targeted, verifiable actions, then refine thresholds after you see outcomes in the crop. To implement, start with one or two problem zones and expand only after you confirm sensors and field observations “speak the same language.”