Soft fruit in tunnel raspberries often shows up when the plant goes through short “waves” of stress: brief deficits followed by heavy irrigations, or salt accumulation in the root zone that makes water uptake harder to regulate. Under protection, these swings are amplified by temperature and ventilation, even when outside conditions look steady.
The key is not a fixed watering recipe, but a loop: measure what happens in the soil and in the root-zone solution, make a small decision (duration, frequency, concentration), then check whether both sensors and plants confirm the change. For raspberries, the root system is sensitive to both excess water (poor aeration) and drought.
Below is a practical protocol for linking irrigation and fertigation to moisture sensors (and, where feasible, soil temperature), plus EC/pH measured correctly in the right medium. The focus is placement, commissioning, independent checks, and early signals that help you avoid stress and softening—without guessing.
1) The mechanism: why swings create stress and can lead to soft fruit
In a tunnel, raspberries can transpire strongly at midday, while nights can bring long periods of high humidity inside the canopy. If the root zone alternates between too dry and too wet, the plant’s water flow toward fruit can become uneven. A practical symptom is variability: berries that feel firmer in the morning and noticeably softer later, or large differences between rows managed “the same way.”
A calcium link is sometimes discussed: after a deficit, abrupt re-watering may accelerate tissue expansion, while calcium (with limited mobility) may not keep pace under some conditions, potentially contributing to weaker texture. Treat this as a working hypothesis, not a verdict. Check it by tracking firmness by block, looking for leaf symptoms consistent with deficiency, and—if you have access—running leaf/fruit Ca analyses and correlating them with the moisture history.
2) Choose sensors based on the decision you need to make, not the catalog
For irrigation, you need a soil-moisture sensor that shows dynamics during short irrigations: how fast it rises after drip starts and how quickly it falls between events. In soil, root-zone temperature also matters because cool soil can reduce uptake even when “moisture looks fine.” For microclimate, air temperature and relative humidity help explain water demand (VPD calculated from air T/RH is an estimate; leaf temperature may differ).
For fertigation, pH and EC require dedicated probes and—more importantly—a clear method: what exactly are you measuring? EC/pH in source water, in the fertigation line, or in the root-zone solution are not equivalent. A laboratory water test (pH, alkalinity, soluble salts) remains your reference; on-site monitoring tells you whether you have day-to-day drift or salt build-up in practice. EC cannot identify which nutrient is missing—only the total dissolved salt load.
3) Placement in a tunnel: one point can mislead you
In a tunnel, edges dry and warm differently, row ends get more airflow, and low spots can stay cooler and wetter. Define at least two zones: one “fast” (warmer/more exposed) and one “slow” (cooler/more shaded). In each zone, choose a representative row and a point where irrigation is typical (not near joints, filters, or the very end of a line).
Depth must match active roots and emitter position. Install into undisturbed soil within the rooting volume—not into a pocket of loosened backfill. If the sensor doesn’t react to irrigation, or reacts excessively, suspect placement first. Hypothetical example: if the probe sits too close to an emitter, you’ll see artificial “spikes”; moving it 5–15 cm laterally/vertically (depending on root architecture and drip layout) can make readings more representative.
4) Commissioning moisture: turn charts into working thresholds
In the first 7–14 days, don’t chase a “perfect number”—watch the response. Record three anchors: (1) the level before the first irrigation of the day, (2) how much moisture rises after a normal event, and (3) how fast it declines until the next event. With two zones, compare the drying slope: a zone that drops much faster may have different soil texture, more wind exposure, or uneven water distribution.
A practical decision to reduce stress is to fragment irrigation: several smaller pulses instead of one large event, so soil avoids extremes while staying aerated. Verify results in two ways: in data (smaller amplitude between peak and minimum, and repeatable response to each pulse) and in the crop (less midday leaf “droop,” more uniform fruit within the same block, and reduced row-to-row variability).
5) EC/pH in soil-grown tunnel raspberries: measure the root zone, not just the tank
The most common mistake is to measure EC/pH in water or in the fertigation line and assume that is what roots experience. In soil, salts can concentrate between irrigations, and rhizosphere pH can drift differently than the tank—especially when irrigation water has high alkalinity. Use one practical method and keep it consistent: either collect soil solution with a suction-cup device (suction lysimeter), or use a standardized soil extraction (for example, an extract made from a fixed volume of soil mixed with distilled water, prepared the same way each time).
Whatever method you choose, standardize timing: compare “before fertigation” with “after the solution has moved through the active root zone.” In practice, that means sampling at the same distance from the dripper and the same depth as active roots, in a repeatable time window (for example, a fixed interval after the first fertigation pulse of the day). Independently verify with a calibrated handheld pH/EC meter, and remember EC depends on sample temperature; compare at similar temperatures or use correct compensation.
6) Tie fertigation decisions to trends, not isolated numbers
Instead of searching for a universal EC or pH target, follow trends and zone differences. If root-zone EC rises day after day while moisture data shows strong drying between pulses, that’s a clue for salt concentration. A practical decision could be to increase irrigation frequency with a less concentrated feed (while maintaining aeration), slightly reduce fertilizer concentration, or shift timing so the main feeding aligns better with peak transpiration rather than preceding a long dry-down.
Leaching or “rinsing” events are sometimes discussed. In soil and tunnels, use them only as a controlled, verifiable intervention—not a reflex. Before: confirm you have functional drainage and won’t create waterlogging (root risk). During: if possible, collect a soil-solution sample (or drainage water where it exists) to confirm EC is actually dropping. After: check over the next 24–48 hours that moisture returns to a normal rhythm (no prolonged excess) and that plants don’t show “hunger” signals (color, growth) from over-dilution.
7) Useful alerts: define “no response” and “zone drift”
Good alerts are not about perfection; they flag deviations that deserve verification. For moisture, a robust pattern (without a universal numeric threshold) is a “weak irrigation response” alert: if, after a standard pulse, the sensor shows less than a minimum rise versus that zone’s baseline, suspect distribution issues (clogged emitter, pressure, valve) or probe placement. Define the “minimum rise” as a percentage of the typical rise you observed during commissioning—not as a fixed value.
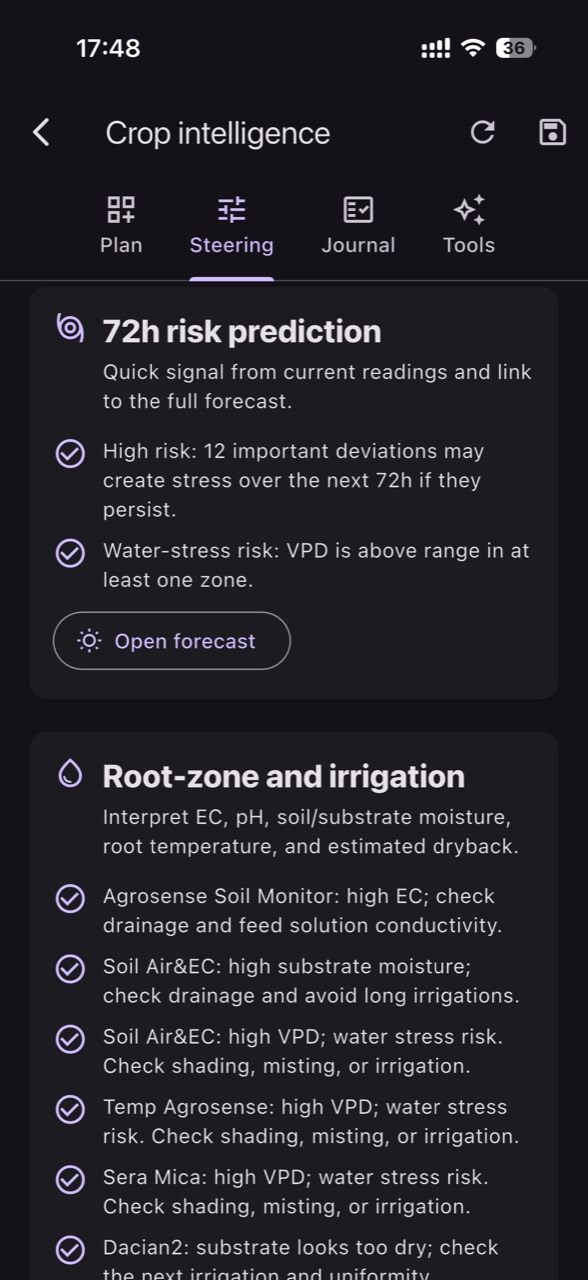
A second pattern is “zone divergence”: if Zone A becomes consistently drier (or wetter) than Zone B in a new way while the irrigation program is identical, don’t jump straight to “add more water.” Independently verify emitter uniformity, line-end pressure, leaks, mulch condition, and wind exposure. Only then adjust. In GrowGuard, zone-based alerts and real-time comparisons help precisely because a tunnel is not uniform—but the final decision still needs field confirmation.
8) Crop verification: a simple dashboard for firmness
If your goal is fewer soft berries, you need a repeatable measure—even a simple one. Set an internal protocol: the same rows, the same relative time (for example, morning), the same ripeness stage, and a consistent firmness rating method (ideally with an instrument; if not, with a well-defined internal scale). Link your notes to moisture history and fertigation events (recipe changes, stoppages, rinses).
When you change something, verify in two stages. Stage 1 (24–48 hours): do charts show smaller moisture swings and fewer EC/pH spikes in your sampling method? Stage 2 (about a week): does firmness variability drop between rows and across different weather days? If not, revisit hypotheses: the issue may be microclimate (high canopy humidity, fruit more exposed to Botrytis), or a root-limited patch. Disease-risk alerts are indicative, not pathogen detection—use them to trigger scouting, not as a diagnosis.
Conclusion
In tunnels, raspberry control means linking three things: water demand (climate), water availability (soil moisture and aeration), and chemical “friction” in the root zone (EC/pH measured in the correct medium with a repeatable method). Soft fruit is often a sign that something is oscillating—not necessarily “too little water” or “too much fertilizer” considered separately.
Build the working loop: commission sensors by zone, set alerts based on response and divergence, verify distribution and sampling in the field, then track firmness as your outcome indicator. If you want to centralize zones, trends, and team alerts in one place, GrowGuard can support the monitoring side; start with two zones and a verification protocol—not a “standard” irrigation schedule.