Chrysanthemum is a photoperiodic crop: the correct switch from long days to short days (or the reverse, depending on your production method) determines when floral buds are initiated. In a greenhouse, small “drifts”—a light leak at night, a cooler or wetter corner—can split a batch into different rhythms, causing poor uniformity and delayed flowering.
At the same time, the microclimate inside the plant canopy changes faster than you can reliably see. After irrigation or at sunset, the air can become too humid and leaves may keep a water film or develop condensation. Those intervals do not automatically mean disease, but they create conditions that favor Botrytis and other foliar problems, especially where ventilation is uneven across zones.
The key is to treat the greenhouse as a mosaic of zones, not as a single control point. Stabilizing photoperiod and climate requires correct measurement (units and placement), alerts that highlight local drift, and a field verification routine. With zone sensors and alerts in GrowGuard, you can identify where deviations start and whether your intervention actually improved the situation.
1) Why flowering gets delayed: photoperiod mechanism and stray night light
Chrysanthemums respond to night length. That is why supplemental lighting and “night break” strategies, as well as blackout screens, must be consistent in both time and space. A single stray light source (doorway, aisle, control panel, streetlight) can shorten the perceived night in that area. The typical outcome is a non-uniform crop: some benches initiate buds later, and the difference becomes obvious only when it is expensive to correct.
What to observe: differences in plant height, longer internodes in light-polluted zones, staggered bud appearance, and a fragmented harvest schedule. What to verify independently: inspect the greenhouse in full darkness after your eyes adapt, looking for light leaks; a hypothetical night photo with longer exposure can help reveal weak points. Practical decision: seal screens, reroute service lights, restrict night access. Result check: after changes, compare initiation uniformity between monitored zones at the same crop stage.
2) Temperature: stability matters more than a “perfect” number
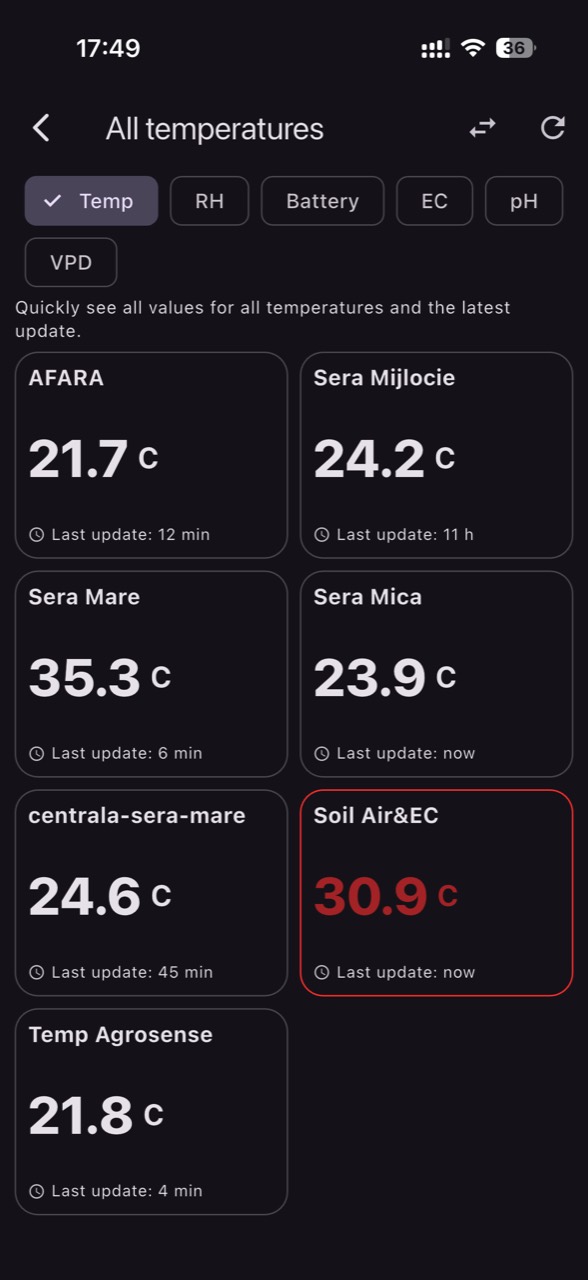
Temperature influences physiological speed—vegetative growth, bud development, and the rate of flower opening. In greenhouses, differences commonly appear at tunnel ends, near doors, along thermal curtains, under hanging baskets, or close to heating pipes. In chrysanthemums, these differences translate into staggered batches: some plants “run,” others lag, even when the daily average looks acceptable on paper.
What to observe: zones with faster growth, smaller leaves in warmer pockets, or softer tissues after aggressive heat/vent cycles. What to verify independently: confirm sensors are positioned at crop height and shielded from direct radiation; also check the canopy temperature, not only the walkway air. Practical decision: adjust air circulation and aim to even out heating/shading by zone. Result check: track whether day–night swings and zone-to-zone differences shrink—rather than chasing a single number at a single point.
3) Humidity and VPD: how condensation and Botrytis risk windows form
Relative humidity alone can be misleading: the same percentage means different moisture conditions at different temperatures. That is why VPD (vapor pressure deficit) helps: derived from air temperature and relative humidity, it describes the “pull” the air has for water via transpiration. Important: VPD calculated from air is an estimate; leaf temperature can be lower than air temperature, especially at night or under screens, increasing leaf condensation risk even when the sensor looks “fine.”
What to observe: after sunset or irrigation, patches of glossy/wet foliage, a damp smell, or petals becoming more prone to spotting close to harvest. What to verify independently: locate cold points (near walls, corners, under beams) and confirm whether air is stagnant inside the canopy. Practical decision: increase air exchange or apply gentle heat to lift leaf temperature above dew point without overdrying. Result check: after intervention, the duration of very low-VPD periods drops and local condensation episodes become less frequent.
4) Making photoperiod stable in practice: screens, lighting, operational discipline
Stabilizing photoperiod is not just “on/off at a fixed time.” It is repeatability without exceptions. Blackout screens must close completely with no gaps; work lights must be separated from horticultural lighting and controlled tightly. Reflections also matter: white film, shiny aisles, or walls can carry light into unexpected areas, especially in partially compartmentalized structures.
What to observe: different responses near aisles or entrances even when a lamp does not shine directly on the crop. What to verify independently: do a night audit along the team’s real route (doors, storage, technical room), not only next to the benches; confirm timers and emergency/safety lights. Practical decision: standardize procedures (for example, limited access and masked lighting where your production method allows it). Result check: in subsequent cycles, track whether phenology differences between edges and the center disappear.
5) Sensor choice and placement: measure the crop, not the greenhouse wall
For temperature/humidity/VPD, use properly shielded, naturally ventilated air sensors mounted at canopy height or slightly above—but not in the direct stream of hot air and not against glass/film. The classic mistake is one “representative” point near the automation cabinet that misses corner and end-wall microclimates, under-screen pockets, or dense canopy conditions. In chrysanthemums, canopy density changes over time, so the microclimate evolves as the crop fills in.
What to observe: big differences between benches, symptoms appearing only in certain rows while the “central” reading looks fine. What to verify independently: compare readings from two to three points in the same house; if a difference is persistent, do not label it “sensor error” until you prove it. Practical decision: define real zones (end, center, door area, hanging-basket area) and place one sensor per critical zone. Result check: after relocation, zone curves should reflect heating and ventilation logically, without physically impossible jumps.
6) Data freshness, units, and common failures: avoid decisions on stale information
In microclimate control, timing matters. A VPD that was critical 90 minutes ago may already be history—and your action may be late. Whether you use LoRaWAN, NB‑IoT, or an MQTT integration, verify the reporting rhythm and real latency, especially in greenhouses with difficult signal conditions. Also keep units straight: temperature in °C, humidity in %, VPD in kPa. Alerts must be built on the same units across the whole team to prevent misinterpretation.
What to observe: alerts that arrive “after it happened,” or data gaps during critical windows (night, storms, power interruptions). What to verify independently: correlate alerts with greenhouse event logs (vent opening, heat start) and direct observations; check sensor battery and status when you see missing data. Practical decision: adjust reporting frequency and gateway/antenna position (for radio) or buffering and QoS (for MQTT) as a separate project from automation. Result check: after changes, confirm continuity of time series and fewer “ghost” alarms caused by missing data.
7) Zone alerts: robust thresholds and clear actions in GrowGuard
The best alerts are not the most sensitive; they are the ones that consistently trigger the right action. Instead of watching a single humidity threshold, build zone alerts for combinations: low temperature plus high humidity (condensation risk), very low VPD sustained over time, or large differences between zones (a sign of uneven air distribution). In GrowGuard, zone alerts only make sense if your zones match real greenhouse structure—benches, compartments, end walls, and hanging levels.
What to observe: repeated alarms in the same zone at the same time of day, suggesting a structural cause (weak airflow, cold corner, imperfect screen). What to verify independently: go physically to the flagged zone and look for the mechanism—fan off, screen stuck, a door that does not seal, condensation on structure. Practical decision: for each alert, define a simple response sheet (who checks, what is adjusted, and for how long). Result check: after intervention, verify shorter episode duration and smaller zone-to-zone differences in the graphs.
8) Post-intervention verification: proving you stabilized the crop
After you change ventilation, seal screens, or rework air circulation, you need verification that avoids self-deception. In chrysanthemums, the final indicator is uniform phenology, but that arrives late. In the meantime, track intermediate indicators: fewer “sticky air” intervals inside the canopy, reduced temperature gaps between ends and center, and the disappearance of recurring condensation in the same corners. Keep a simple journal of what changed and when.
What to observe: immediate improvements in curves, but also side effects (for example, localized cold drafts after increasing ventilation). What to verify independently: inspect leaves at dawn, when dew point risk is often highest; look for wet leaves when you have not irrigated. Practical decision: fine-tune with small repeated corrections rather than large swings, and rebalance zone by zone. Result check: compare zone history weekly; if the “problem zone” migrates, the cause may be airflow patterns rather than a single faulty component.
Conclusion
Stabilizing chrysanthemum photoperiod and microclimate is fundamentally an exercise in consistency: light without leaks, temperature without thermal islands, and humidity/VPD without long condensation windows. Sensors tell you when conditions become conducive to disease, but they do not confirm the presence of a pathogen; therefore, alerts should send the team to physical checks and targeted greenhouse corrections.
When you treat the greenhouse by zones and verify the effect of each intervention, flowering delays and quality losses become easier to anticipate and correct. If you want, you can set up zone monitoring and alerts in GrowGuard so each deviation is localized and followed through to resolution rather than averaged into a single value for the whole house.