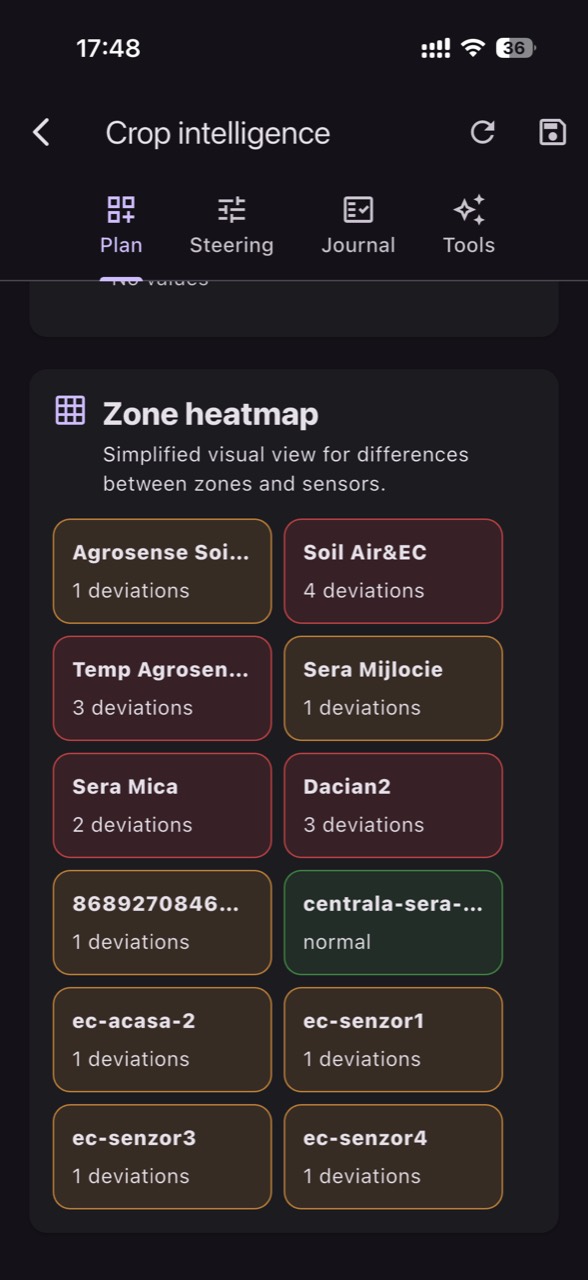
When you look at a crop through a single value (one temperature, one humidity, one EC), you risk treating a “point” as if it describes the whole area. In reality, the same tunnel, greenhouse, or field block has zones: row ends, edges, shaded strips, areas near doors, sections with different soil, or irrigation lines that behave differently.
A sensor map is not just a nice visualization; it is a diagnostic tool. It helps you compare microclimates, see whether an anomaly is local or systemic, and decide whether you have an agronomic issue, an equipment issue (irrigation/ventilation), or a measurement issue (placement, units, sensor drift).
This article is a practical guide for separating real crop problems from misleading readings. You’ll find a working protocol: how to define zones, choose and place sensors so they measure “what matters,” how to verify independently, and how to take a practical decision followed by a check that the decision actually worked.
1) Why the “whole-farm average” hides the real problem
The mechanism is simple: spatial variability is real, and the crop responds locally. In tomatoes, for example, a corner with higher VPD can speed transpiration and create midday water stress even when the “average” air humidity looks fine. In open fields, a change in soil texture alters infiltration and root-zone water availability, so two nearby areas can behave like different crops under the same weather.
What to observe: symptoms appear in patches, not uniformly (wilting in one sector, smaller fruit on edge rows, uneven vigor). What to verify independently: walk a fixed route and note where symptoms start and stop; take a quick spot-check with a portable thermometer/hygrometer, a mobile soil probe, or a visual inspection of drippers and wetting patterns. Practical decision: treat the zone, not the whole farm. Result check: after the intervention, the difference between zones should shrink—not merely the overall “average” shifting.
2) Defining crop zones: how to split space so comparisons are fair
Zones should follow physical causes, not just the geometry of a plot. In greenhouses/tunnels, separate: ends vs middle; near doors/vents vs interior; near cold walls vs center; under screens/shade vs without. In fields or orchards: slope vs low spot; heavier vs sandier soil; areas with different irrigation pressure; edge rows exposed to wind. This makes microclimate comparisons meaningful rather than accidental.
What to observe: if the “problem” always shows up in the same zone, a local driver is likely (draft, shading, compaction, flow). What to verify independently: mark zones on a simple sketch, then ground-truth them—valve locations, dripline layout, fans, screens, heaters, obstacles. Practical decision: create a reference (control) zone plus one or more risk zones. Result check: when you change something, test it in one zone first and confirm the difference versus the reference shifts in a predictable direction.
3) Air sensor placement: avoiding readings “in the path of airflow”
Air temperature and humidity sensors are highly placement-sensitive. Direct radiation, proximity to walls, and jets from ventilation or heating can create readings that don’t represent the canopy. VPD calculated from air temperature and relative humidity is an estimate; leaf temperature can be cooler or warmer than air, especially in strong sun or under fine misting. If a sensor sits in a micro-draft, you can misdiagnose “stress” that is mostly measurement artifact.
What to observe: short, repeatable spikes when ventilation switches on, or large differences between two sensors placed close together without an agronomic explanation. What to verify independently: compare with a calibrated portable reading at leaf level and again 1–2 meters away; confirm the sensor is shielded and mounted at a height relevant to the canopy. Practical decision: relocate the sensor or add a second sensor in the same zone for validation. Result check: equipment-linked “peaks” disappear, and the daily curve becomes consistent with day/night progression.
4) Soil/substrate sensor placement: measure the root zone, not the convenient spot
With soil or substrate moisture, the classic error is placing the probe outside the active root volume, or in a spot that doesn’t receive water like the rest. In a drip bed, a few centimeters can change moisture dramatically. In substrate (such as coco/perlite), gradients are fast: the top dries quickly while the lower profile can stay wet. If the sensor is too close to an emitter, you may believe irrigation is adequate while roots at the edge of the wetting bulb still suffer.
What to observe: the sensor reads “wet” continuously, yet plants show slight tip burn or midday droop; or the sensor reads “dry” while surface algae/mold suggests prolonged wetness in another layer. What to verify independently: open a small inspection section and look at moisture distribution; check flow uniformity along the line and the distance from the emitter. Practical decision: reposition the probe into the middle of the wetting bulb and at the depth where most roots are active. Result check: after an irrigation event, the curve rises and falls logically, and field observations align with the data.
5) EC and pH: same number, different media, different conclusions
EC and pH are often interpreted from “a single value,” but the medium and method are decisive. EC in irrigation water, EC in fertigation solution, EC from a substrate extract, and EC in soil (via probe or extraction) are different measurements and do not translate directly. EC indicates total soluble salts; it does not tell you which ion is missing. And a temperature sensor cannot measure EC/pH—those require dedicated probes and correct sampling routines.
What to observe: a “high EC” in one spot while plants look fine, or a pH that seems to “jump” without changes in fertilization. What to verify independently: confirm units and the measurement medium (water, solution, substrate, soil) and cross-check with a calibrated portable meter; for substrate/soil, keep the sampling method consistent each time. If clarity is needed, laboratory analysis remains the reference; on-site pH/EC monitoring complements it rather than replaces it. Practical decision: do not change nutrition until you know exactly what was measured. Result check: after any adjustment, follow the trend in the same zone with the same method—do not compare unlike measurements.
6) When zone differences point to equipment problems, not crop problems
Zone maps reveal mechanical patterns: one zone stays drier after every irrigation (a low-flow sector), one zone has higher night humidity (local ventilation shortfall), or temperature is consistently higher by a wall (insulation or heat source effect). In peppers or cucumbers, persistently high humidity in one area can increase local condensation risk even if the rest of the structure is “within limits.” The crop reacts to the local environment, but the cause can be hardware.
What to observe: a repeatable anomaly in the same zone, synchronized with pump starts, vent openings, or heating cycles. What to verify independently: physically inspect that sector (filters, pressure, drippers, valves), then confirm timing—right after irrigation, root-zone moisture should increase in all zones; after ventilation, RH should shift coherently. Practical decision: repair or rebalance equipment in the affected zone. Result check: step-like differences between zones after the same event fade, and the response becomes similar across comparable zones.
7) When zone differences indicate a real microclimate (and how to manage it)
Real microclimates persist because of environmental causes: shading from a hedge, prevailing winds, cold-air pooling in a depression, or thermal reflection from a surface. In an orchard, a low area can have lower minimum temperatures and longer leaf wetness; in a tunnel, the zone near a door can swing more day-to-night. If you manage everything identically, you either overcorrect the good zones or under-protect the vulnerable ones.
What to observe: differences that show up mainly at morning/night (cold air) or at midday (radiation/shade), repeating across multiple days. What to verify independently: compare with visual cues (dew/condensation, felt airflow, slower growth patches) and with local forecast context to see if the pattern matches weather drivers. Practical decision: manage by zone—directed ventilation, local screening, improved air circulation, or sector-specific irrigation strategy. Result check: differences may not disappear, but they should become less severe at critical times (for example, fewer extreme peaks).
8) A rapid diagnostic protocol: from alert to probable cause in 30–60 minutes
When an alert or suspicious value appears, don’t start from “the plant has a problem.” Start with: is this change local or global? A map and zone-to-zone comparison are the first filter. Next, check physical plausibility: does the change align with an event (irrigation, ventilation, cloud cover, rain)? If not, suspect placement or sensor issues (drift, loose contact, stuck values) before escalating to a crop-wide response.
Practical (hypothetical) steps: 1) compare two similar zones; 2) review the last hour and last day of history for context; 3) do a quick independent field check; 4) take a minimal, reversible decision (fix one irrigation sector rather than changing the whole recipe); 5) define what “success” should look like in the next 1–2 cycles. In a platform like GrowGuard, zone maps and zone-based alerts support this workflow without forcing you to diagnose from isolated tables.
Conclusion
A crop is not a number; it is a network of microclimates and root-zone volumes that respond differently to the same day. When you organize sensors by zones and place them to measure agronomic reality (not the convenient corner), you shorten the path from “this looks odd” to “I know the likely cause.” That means fewer unnecessary interventions and better control of local risk.
If you already use digital monitoring, build a routine: zoning, comparisons, independent verification, and post-decision confirmation. And if you need a clear on-field view for the whole team, a sensor map (for example, in GrowGuard) can be the shared frame for discussing the same reality and investigating zone differences faster.