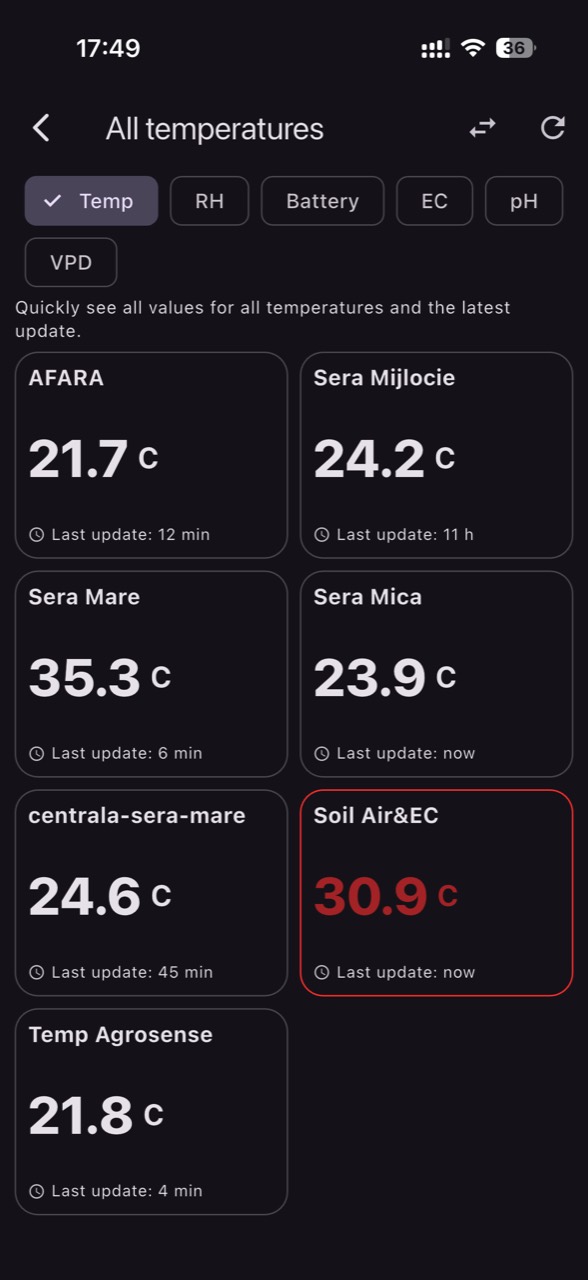
In horticulture, “data” is only useful when it stays connected to plant physiology and field reality. Many problems start with rushed interpretation: a temperature spike can be direct sun on a sensor, a soil-moisture drop can be an air gap next to the probe, and a high EC value can come from a different medium than you think you’re measuring.
A good diagnostic guide starts with one question: what else could produce the same reading, through a different cause? In practice, symptoms (wilting, chlorosis, stalled growth) often appear after the microclimate or root zone has already drifted out of balance. That’s why it’s worth monitoring key parameters—but with independent checks and a routine for confirmation.
Below is a differentiation-focused protocol: real problem versus sensor/process problem. For each parameter, we cover the mechanism, what you can observe in the crop, what to verify separately (with simple measurements or inspections), one practical decision you can take, and how to check whether the intervention had the desired effect. Examples are hypothetical so you can adapt them to your farm.
1) Air: temperature and relative humidity—with “shadows” and drafts
Mechanism: air conditions drive transpiration, photosynthesis, and leaf heat balance. A temperature reading that’s too high can come from a genuine heat event, but also from radiation loading (sun hitting the sensor body) or mounting near a heater, motor, or hot pipe. Likewise, relative humidity can be distorted by misting, condensation on the housing, or stagnant air in a corner of a protected structure.
What to observe and verify: look for zone differences (tunnel ends, by doors, under screens). Verify independently with a handheld thermometer/hygrometer at least at a few points, and note whether the event repeats at the same hour (a pattern) or appears as abrupt “jumps.” A practical decision could be adjusting ventilation/shading or reducing moisture sources. Confirmation: after the change, track whether extreme episodes become shorter and whether plants regain normal turgor over the next 1–2 daily cycles.
2) Soil: moisture, temperature, and the correct root layer
Mechanism: the root zone has inertia; it changes more slowly than air, but it directly controls water and oxygen availability. A sudden soil-moisture drop may indicate an irrigation sector that didn’t water, yet it can also be poor probe contact (air pocket, installation in loose soil) or the wrong depth relative to the main root mass. Soil temperature can explain stress even when air looks acceptable.
What to observe and verify: in field or tunnel, check texture by hand (squeeze test), smell (anaerobic notes), and surface wetting uniformity. With drip irrigation, inspect a few emitters near the sensor zone: flow, clogging, pressure issues. A practical decision: correct irrigation duration/frequency or repair the sector. Confirmation: moisture should rise after irrigation with a realistic delay; if it doesn’t change, suspect probe installation or that the probe sits outside the effective wetting pattern.
3) EC: “salts” in which medium, by which method?
Mechanism: EC (electrical conductivity) indicates total soluble salts and therefore osmotic pressure on the plant. But EC does not identify which ions are present and it does not replace lab analysis. Just as importantly, there is no single “EC”: irrigation water EC, fertigation solution EC, substrate extract EC, and bulk-soil EC are different measurements with different interpretation. Confusing the medium is one of the most common causes of wrong diagnosis.
What to observe and verify: if EC “rises,” look for compatible signs: tip burn, tougher leaves, midday wilt even though the root zone seems wet. Verify independently by measuring EC in the tank/line (solution) and separately doing a substrate extraction or sending a sample for laboratory work—without mixing these numbers as if they were comparable. A practical decision might be a controlled leaching action (where the system allows) or adjusting the fertigation strategy. Confirmation: confirm EC decreases in the same medium you measured, and watch for restored uptake dynamics (water consumption, vegetative progress) over subsequent days.
4) pH: between water, nutrient solution, and the root zone
Mechanism: pH influences nutrient availability and root activity, but measurement has traps: water pH is not the same as fertilizer solution pH, and root-zone pH can differ from drainage pH or a shallow grab sample. In addition, water alkalinity (buffering capacity) can cause pH to “rebound” after corrections, even if the first reading looked good. So chasing a number without understanding the buffering system can mislead you.
What to observe and verify: deficiency-like symptoms can mimic pH lockout, but may also come from temperature stress, salinity, or damaged roots. Verify independently with a fresh measurement (clean electrode, proper stabilization time) and, when possible, with a water analysis that separates pH, alkalinity, and soluble salts (EC). Practical decision: correct the process (mixing, dosing, reaction time), not only the displayed value. Confirmation: track pH stability through the day and whether new leaves develop normal color and growth—not just whether you “hit” a target figure.
5) VPD: valuable, but it is an estimate of evaporative demand
Mechanism: VPD (vapor pressure deficit) is derived from air temperature and relative humidity and describes how strongly the air pulls water from the leaf. It’s highly useful to connect transpiration with ventilation, heating, and shading, but it remains an estimate: leaf temperature can differ from air temperature, especially under strong light or in moving air. This is how you get alarms that are mathematically correct, yet biologically arguable.
What to observe and verify: if VPD suggests high stress, check for matching signs: slight leaf rolling, wilting at consistent hours, elevated leaf temperature (even a simple IR thermometer helps, if available). If VPD seems too low (air “too humid”), watch for condensation, long-lasting leaf wetness, and increasing disease pressure. Practical decision: adjust ventilation/heating/shading to shift VPD direction—not just relative humidity. Confirmation: after changes, track whether episode duration decreases and whether zone-to-zone spread narrows (microclimate uniformity improves).
6) Forecast: decision context, not proof the problem exists
Mechanism: a forecast helps anticipate risk (frost, heat waves, dry wind, long wet periods), but it does not measure what happens in your crop. A common error is to automatically attribute a symptom to the forecast: for example, leaves droop and you conclude heat stress simply because a hot day is coming, while the true cause may be a missed irrigation event or a root-zone EC increase. Forecast should be tied to local history and the real exposure of your block or structure.
What to observe and verify: check outside-versus-inside differences (in protected crops), cloud and wind effects on ventilation, and timing of transitions (fronts). Independent verification is “ground truth”: your own station/sensor data plus a quick walk-through before the event. Practical decision: prepare preventive measures (shading, irrigation management, frost/heat protection steps) but also set a post-event verification plan. Confirmation: compare parameter evolution during the event to the outcome you aimed for (for example, limiting time spent at extremes) and record what worked for next time.
7) Fresh data, units, and “stuck values”: how to spot an equipment problem
Mechanism: crops change continuously; if data is delayed or stuck, you make decisions for a past that no longer exists. Typical issues include weak batteries, intermittent connectivity, contaminated sensors, slow drift, or mounting artifacts (insufficient shielding, strained cable, probe partially pulled out). Wrong units—or wrong conversions between platforms—can create non-existent “problems,” such as treating water EC and substrate EC as if they were the same measurement.
What to observe and verify: look at the rhythm of data (steady interval versus gaps), impossible step changes, and alignment with operations (irrigations, sprays, vent openings). Verify physically: placement, cable integrity, probe cleanliness, contact with soil/substrate. Practical decision: before changing recipes or schedules, validate the sensor with a control measurement and, if needed, reinstall or recalibrate. Confirmation: after the technical fix, watch whether realistic dynamics return (response after irrigation, day–night cycle) and whether alerts become consistent rather than noisy. In GrowGuard, status and history views can help you see gaps and patterns quickly.
8) A cause-based diagnostic protocol: from symptom to parameter and back
Mechanism: the same symptom can come from different causes, and the same parameter deviation can be “normal” at a given phenological moment. In a tomato crop (hypothetical example), midday wilting can be high VPD, but also elevated root-zone EC or a partially clogged drip sector. In a lettuce crop (hypothetical example), burnt margins may be salinity—but also large swings in substrate moisture. That’s why you need steps, not assumptions.
What to observe and verify: start from the symptom and define the zone (how many rows, which end, which lot). Then check 2–3 correlated parameters: air (T/RH), VPD, soil moisture, plus EC/pH in the correct medium. Follow with a quick independent check: irrigation hardware inspection, portable measurement, and a lab sample if the issue repeats. Practical decision: make one controlled change (for example, adjust ventilation or correct irrigation in one sector) and confirm within 24–72 hours: parameters respond and new symptoms stop—rather than relying on “it looks better today.”
Conclusion
Monitoring air, soil, EC, pH, VPD, and forecast is worth it only if you know exactly what you measure, in which medium, how fresh the data is, and how it maps to plant function. Good diagnosis compares hypotheses: crop problem, irrigation/climate equipment problem, sensor problem, or interpretation problem. A simple independent check often prevents expensive wrong turns.
If you use a platform like GrowGuard, the real advantage comes when you interpret by crop zones and review history after interventions—not just current values. Invite the team to note interventions (irrigation, ventilation, recipe changes) and verify effects both in the data and in the plants; that’s how monitoring becomes practical risk control.