In a greenhouse or tunnel, many decisions look simple until weather, humidity, temperature and crop rhythm change at the same time. A grower sees the plants, knows the site and can often feel when something is not right. But no person can watch every zone all day and all night, and the difference between a shaded area, an exposed area, a wet root zone and a dry one can remain hidden until the plant shows the result.
GrowGuard starts from a simple idea: data should be useful, not just abundant. The platform collects readings from LoRaWAN, NB-IoT, MQTT or TTN API sensors, places them on a sensor map, connects them with forecast and turns them into alerts, history, reports and operational priorities. Instead of checking every device separately, the user sees where the crop is moving away from the expected range.
This article explains how live monitoring can become a practical decision tool for greenhouses, tunnels, flower production, vegetable crops and other high-value horticulture systems. The goal is not to replace grower experience. The goal is to give that experience a clearer view of what changed, where it changed, how long it lasted and what should be checked first.
From isolated readings to agronomic context
A temperature or humidity reading is useful only when you know where it was measured, when it happened and how it compares with the rest of the crop. High humidity may be normal after irrigation, but it can become a risk if it remains high overnight, when ventilation is reduced and leaves stay wet. A good air temperature can still hide a cold root zone or an uneven climate between two greenhouse areas.
GrowGuard puts those readings into context. The sensor map shows position, the dashboard shows current status and the history shows whether an episode is accidental or repeated. When the values are read together, the decision no longer starts from a feeling alone. It starts from a clearer pattern: what changed, how strongly it changed and which zone deserves attention first.
What a monitored crop can actually measure
Depending on the connected sensors, GrowGuard can track air temperature, air humidity, soil temperature, soil moisture, EC, pH, battery, sensor status, LoRaWAN payload values, NB-IoT values, MQTT values and other readings that are useful for crop management. In greenhouse crops, the combination of air, root zone and forecast matters because the plant responds to the whole growing environment, not to one indicator.
A practical example is the difference between two zones inside the same greenhouse. If one zone has higher humidity and slightly lower temperature, disease pressure may increase locally even when the general average looks acceptable. If a soil sensor shows high moisture but the crop still looks stressed, the question may involve root temperature, substrate aeration, EC or irrigation strategy. Good monitoring does not give absolute answers automatically, but it helps the team ask better questions.
How LoRaWAN, NB-IoT and MQTT sensors help
In agriculture and horticulture, connectivity matters as much as the sensor itself. LoRaWAN is often useful for low power and long distance, NB-IoT can work well where cellular coverage is stable, and MQTT is common in technical integrations, gateways and existing automation systems. GrowGuard is built to receive data from multiple sources so the grower or distributor is not locked into one architecture.
For the user, the important part is not the protocol name. The important part is that the values arrive in a readable and actionable form. GrowGuard can work with existing devices, import TTN applications through API and help interpret payloads with AI, with user validation before saving the mapping. That reduces the time between installing a sensor and using it in a real decision.
Good alerts reduce unnecessary checking
Without alerts, monitoring becomes another list someone must check every day. With poor alerts, the system becomes noisy and people start ignoring it. A good alert is clear, connected to a relevant threshold and specific enough to tell the team where to look. In GrowGuard, an alert can be connected to a sensor, a zone, a metric or a risk that is explained with context.
For example, a high-humidity alert should not automatically be read as a problem. It may mean ventilation needs checking, a cover stayed closed too long, irrigation happened late or the forecast points to a cold night. The real value appears when the alert leads to a concrete field check and a faster decision than visual observation alone would allow.
Sensor maps and the difference between zones
Many crops are not uniform. In a long greenhouse, the ends may behave differently from the middle. In an orchard, one block may be more exposed to wind. In a vineyard, slope and soil can completely change water retention. The GrowGuard sensor map helps users read measurements in their real location, not only in a table.
This perspective is useful when work must be prioritized. If three sensors show deviations, the map shows whether the issue is concentrated or spread across the site. If the same zone is always different, the reason may be ventilation, irrigation, drainage or sensor placement. When data has location, team discussions become more precise: go to this zone, check this device and compare it with the last few days.
Forecast changes how current data should be read
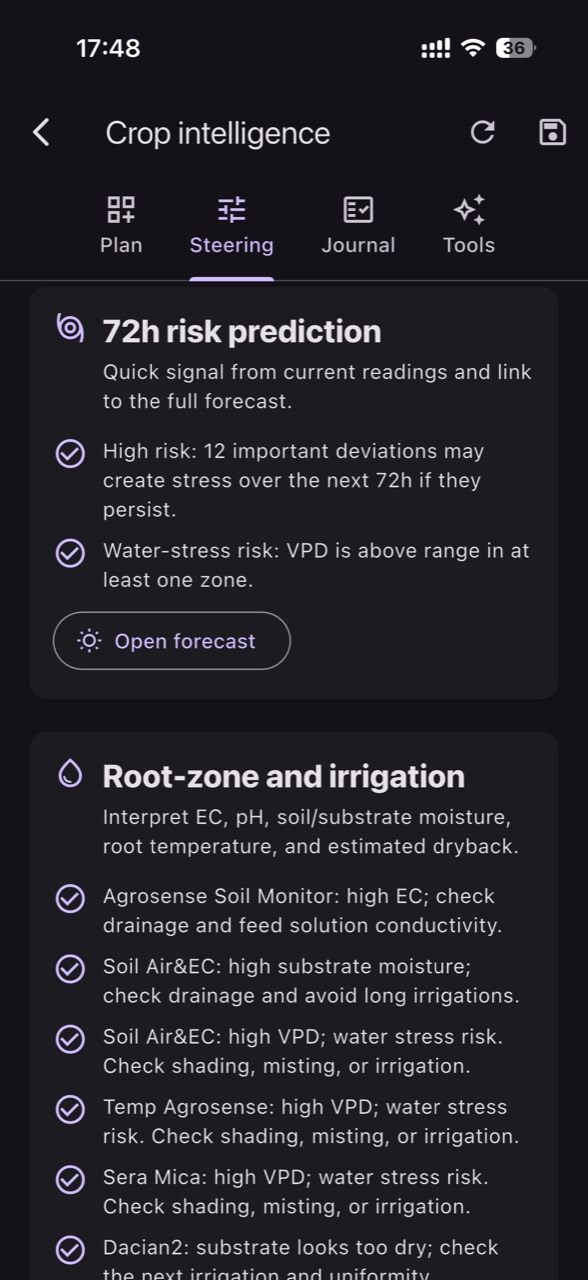
A current value is only the beginning. If the forecast announces a cold night, high humidity must be read differently. If hot days are coming, water stress can develop faster. If disease pressure is favored by temperature and moisture, ventilation, irrigation or scouting decisions should be made before symptoms become visible.
GrowGuard combines monitoring with forecast and history to support preventive decisions. The application does not decide instead of the grower. It shows where conditions are changing and which parameters deserve attention. This is especially useful in high-value crops, where one delayed day can create cost, quality loss or more difficult interventions.
Reports, history and learning from the season
Live readings matter today, but history matters for learning. When the team can see how temperature, humidity or EC changed over a longer period, patterns become visible. Maybe one zone reacts late to irrigation. Maybe a night interval repeatedly creates risk. Maybe ventilation settings work well in spring but not in summer.
GrowGuard includes history, exports and reports because good decisions are not only reactive. They are built through comparison. A report can support a discussion with the team, a consultant, a sensor distributor or a technical partner. Instead of approximations, everyone can look at the same base: measured data and the context in which it appeared.
How to start practically with GrowGuard
A good start does not mean placing sensors everywhere. It means choosing representative zones and indicators that influence daily decisions. For a greenhouse, a practical starter setup may include air temperature and humidity, a soil or substrate sensor and clear sensor positions on the map. For an orchard or vineyard, placing sensors in different blocks may matter more than installing many devices in one place.
After installation, the first goal is to calibrate expectations: what ranges are normal for the crop, when deviations appear, which alerts are useful and who receives them. GrowGuard becomes more valuable as data accumulates and the team learns how to interpret it. The application provides structure, while the best results come from combining grower experience with continuous measurement.
Conclusion
Monitoring with GrowGuard is not about turning farming into a screen full of numbers. It is about seeing crop conditions earlier and making clearer decisions. Sensors, maps, forecast, alerts and history work together to reduce uncertainty and point attention to the places where it matters most.
For greenhouses, tunnels, orchards, vineyards and horticultural crops, the difference does not come from one measurement. It comes from continuity. When data is followed every day, the crop starts telling a more complete story. GrowGuard helps the grower read that story and act before the problem becomes obvious.