Soybeans respond strongly to water stress, but not uniformly across a field: the same rain or irrigation can leave entire areas below a comfort threshold, especially on lighter soils or where topsoil is shallow. That is why irrigation management in field crops is not just “how much did I apply,” but “how much plant-available water remains in the profile.”
Soil sensors can turn that question into a data stream: moisture and temperature at relevant depths, tracked over time. Their value, however, does not come from a single instant number; it comes from how they are installed, validated, and interpreted together with growth stage, soil texture, and forecast. Without correct commissioning, readings can drive the wrong decisions.
This article explains the technical fundamentals and a usable workflow: how to choose sensors, define representative zones, independently verify what the instrument reports, and make irrigation decisions without rigid templates. The examples are hypothetical and intended for learning, so you can adapt the protocol to your farm and irrigation system.
1) Why soybeans need zone-based decisions, not a farm average
Soybeans have critical windows while building canopy and later during flowering and seed filling. In these stages, water deficit reduces photosynthesis and can lead to flower/pod abortion or incomplete seed fill. The mechanism is amplified during heat: atmospheric demand rises, and the plant closes stomata to limit water loss, which slows growth. A “field average” can look acceptable while the most limiting zones fall into stress first.
What to observe: differences in vigor, slight leaf rolling around midday, and development delays between parts of the same block. What to verify independently: dig or probe to see how far water actually penetrated after irrigation and whether compact layers restrict rooting or infiltration. Practical decision: irrigate the sectors that enter stress first, not the entire area “by calendar.” Check the result: after irrigation, confirm re-wetting at the target depth in the sensor trace and visually assess recovery over the next 24–48 hours at the same time of day.
2) What soil sensors measure—and where unit confusion starts
In field crops, it helps to separate three kinds of information: (1) soil water content (often volumetric water content or a technology-specific equivalent), (2) water tension/energy (typical of tensiometers or resistance blocks), and (3) soil temperature. Water content answers “how much water is there”; tension answers “how hard it is for the plant to extract it.” Two soils can show similar water content but very different availability because texture and structure change how tightly water is held.
What to observe in data: the response to rain/irrigation (a step up then decline), different slopes by depth, and delays between shallow and deeper layers. What to verify independently: compare readings with field inspection after clear events (a meaningful rainfall or a known irrigation). Practical decision: don’t set thresholds from a single “nice” value; derive them from profile dynamics and the crop’s response. Check the result: correct irrigation shows a coherent rise followed by a gradual decline; a line that stays “stuck” or barely moves suggests either an irrigation delivery problem or an installation/reading issue.
3) Sensor selection for soybeans: what truly matters in field crops
In soybeans, roots typically explore deeper than many vegetables, and good irrigation decisions depend on what happens in the active root zone, not only at the surface. In practice, you want measurements at multiple depths: one shallower point for the layer that dries first and one deeper point for the “reserve” supporting the plant between irrigations. Including soil temperature is worthwhile because it influences growth rate and, indirectly, how quickly water use accelerates in warm periods.
What to observe while choosing: suitability for your soil (sandy versus clayey), robustness for repeated installation, long-term stability, and clearly defined units. What to verify independently: request technical documentation on the measurement medium and calibration approach; confirm whether the sensor reports water content, tension, or a proprietary index. Practical decision: prioritize consistency and interpretability over impressive-sounding “resolution.” Check the result: after installation, run a simple response test—one wetting event and then a drying curve; a sensor that does not react realistically should not be used as a decision basis.
4) Zone placement: representative points, not “closest to the road”
A classic field-crop mistake is installing a single sensor in a convenient location and assuming it represents the whole block. For soybeans, stress-prone zones often appear on lighter textures, on knolls, on edges with different drainage, or where history shows heat “burn” patterns. The mechanism is straightforward: those areas hold less water or lose it faster, so they reach deficit earlier even when the field average still looks fine.
What to observe before installing: soil maps, relief differences, satellite imagery, or simply the visual history of prior crops. What to verify independently: dig 2–3 soil profiles (texture, compaction, effective topsoil depth) and observe how irrigation water infiltrates. Practical decision: define 2–4 zones and place sensors in the limiting zones plus one reference zone. Check the result: after the first rains/irrigations, zones should display different curves; if all curves look identical, you likely chose points that are too similar or installed in a spot that artificially equalizes readings (for example, near a water leak or runoff path).
5) Installation and commissioning: steps to avoid “pretty” but false data
Installation quality matters as much as sensor choice. In soil, good contact with the matrix, correct orientation, and avoiding air gaps can be the difference between a faithful signal and noisy artifacts. A useful protocol is: (1) pick the exact location within the representative zone, (2) excavate a face that lets you see stratification, (3) mount at the planned depths, (4) rebuild compaction as close to natural as possible without creating a “pocket” that collects water. Then mark the point and record initial conditions.
What to observe in the first days: whether variation is plausible and whether readings respond to weather and irrigation events. What to verify independently: do a hands-on check after a wetting episode—soil should feel moist at sensor depth without unexpected ponding. Practical decision: before using data for irrigation, validate response over at least 1–2 wetting–drying cycles. Check the result: if a sensor reads permanently too wet or too dry compared with reality, reinstall it; in open fields, reinstalling is often more effective than trying to “fix it in software.”
6) From readings to irrigation choices: a workflow without rigid templates
A practical workflow starts from questions, not universal thresholds. Question 1: “How fast does water decline between irrigations in each zone?” (the slope of the curve). Question 2: “At what level and timing do the first stress signs appear?” (tie the data to field observations). Question 3: “How deep does my irrigation actually reach?” (compare depths). In a hypothetical example, Zone A shows a rapid shallow decline and almost no deep re-wetting after a short irrigation—suggesting the application is too small to rebuild the useful reserve.
What to observe: if irrigation raises only the shallow sensor while the deeper sensor keeps trending down, you wetted mainly the layer that evaporates first. What to verify independently: check moisture depth 12–24 hours after irrigation to distinguish true infiltration from “water bypassing near the sensor.” Practical decision: adjust duration/sectoring to reach the target profile, not just to “green up” the surface. Check the result: in the next cycle, confirm the deeper sensor begins to respond and that the interval to the next irrigation increases without visible stress indicators.
7) Using forecast and heat waves: prevention rather than late reaction
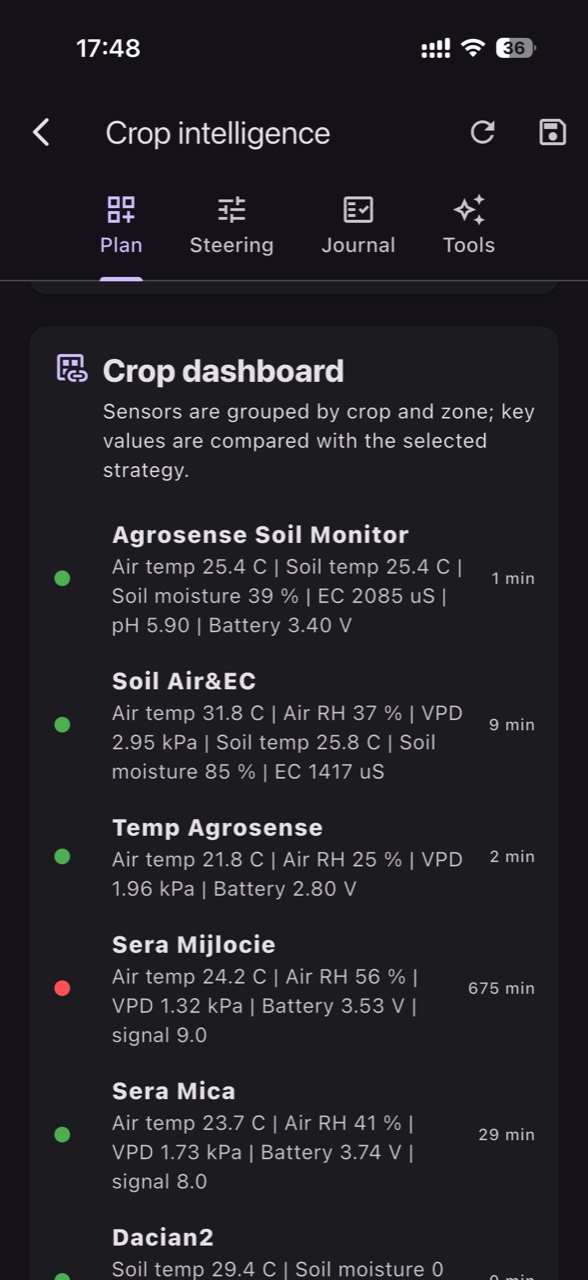
In soybeans, heat waves change the rules: daily water use can increase abruptly, and the crop can enter deficit earlier in the day. Soil sensors show the “reserve,” but good decisions also need context: are 3–5 hot, dry days ahead? Then an accelerated decline in the curves is expected rather than mysterious. In GrowGuard, viewing forecast context alongside moisture curves can support earlier action so irrigation isn’t delayed until the crop has already slowed in a sensitive growth stage.
What to observe: on very hot days, slopes can become steeper and zone differences widen. What to verify independently: observe plants at midday and again in the evening at the same points, noting whether symptoms are transient (recovery by evening) or persistent. Practical decision: if forecast indicates prolonged atmospheric stress, plan irrigation ahead for the first-to-deficit zones without “drowning” heavier zones. Check the result: after the event, compare before/after curves and note whether you reduced the depth of drawdowns and maintained better uniformity between zones.
8) Common failure modes: stale data, drift, compaction layers, and misreads
In practice, issues often come from operations rather than agronomy. Data may be too infrequent or delayed for decisions (for example, long reporting intervals that miss the re-wetting peak), or there may be gaps with no signal. Another failure is drift or poor soil contact producing stable but unrealistic values. A further case is a compaction layer: the shallow sensor shows irrigation, but water does not pass through, so the deeper sensor shows nothing—this is not necessarily a sensor defect; it can be an important agronomic diagnosis.
What to observe: flat lines for days, impossible jumps, or unexplained discrepancies between depths. What to verify independently: check actual moisture at depth and, if you suspect compaction, do a simple profile structure or penetration check. Practical decision: treat data integrity first—freshness, coherence, event response—then establish thresholds and alerts. Check the result: after corrections (reinstalling, relocating, changing the point), confirm the sensor tells the same story as the soil and the crop; without that agreement, any decision automation is risky.
Conclusion
Soybean irrigation based on soil sensors works when you start with the mechanism: plant-available water in the profile, accessibility shaped by soil texture/structure and growth stage, and real differences between zones. A well-chosen sensor, installed correctly and validated over 1–2 wetting–drying cycles, becomes a management instrument rather than a gadget that displays numbers.
To turn data into decisions, keep the discipline of independent verification: dig, compare, record crop response, and validate outcomes after each irrigation adjustment. If you want an easier way to track zones, history, and soil moisture/temperature alerts alongside forecast context, GrowGuard can be used as a monitoring and team-collaboration platform.