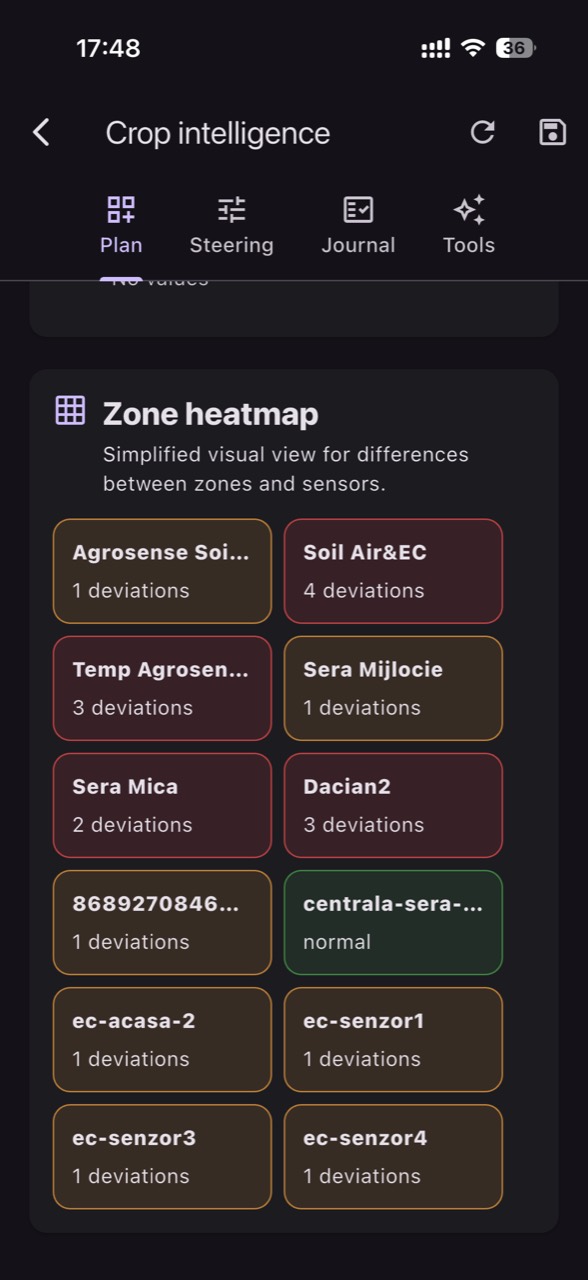
In gerbera, thrips pressure often shows up first as fine symptoms (silvering, black specks, distortions) and only later as visible quality losses. Microclimate doesn’t “create” the pest, but it can open operational windows in which the crop becomes more exposed: leaves can be more stress-prone, flowers harder to protect, sprays less consistent, or monitoring delayed.
VPD (vapour pressure deficit) is an estimate calculated from air temperature and relative humidity. Its usefulness is not to guess thrips biology, but to describe how “dry” the atmosphere feels to the plant and how quickly leaf status can shift. In gerbera, that day-to-day and hour-to-hour dynamic intersects directly with flower quality and with the risk of stress or condensation.
The key is to define risk windows as testable hypotheses in your own greenhouse: combinations of temperature, RH and VPD that repeatedly coincide with trap increases and new symptoms. Then you turn those windows into zone-based alerts so the team scouts correctly, on time, and exactly where microclimate differs—using GrowGuard for monitoring and notifications when helpful.
1) What a “thrips risk window” means—and why VPD is only one piece
A risk window is not a fixed biological prediction; it is a time period when the chance of finding active thrips or seeing new symptoms rises under your specific production conditions. The practical mechanisms are often indirect: leaves can become more fragile under stress, flowers open in waves, and operations (venting, shading, spraying) can rapidly shift the canopy-level microclimate. You observe: trap counts rising, outbreaks that stay localized, and symptoms appearing after certain “typical” kinds of days.
Air-based VPD describes the evaporative pull of the atmosphere, but leaf temperature can differ from air temperature (radiation, drafts, irrigation events, shading). That is why independent verification is mandatory: sticky traps counted consistently, inspections focused on young leaves and flowers, plus logging operational events (sprays, venting, irrigations). The practical decision is not “change VPD to get rid of thrips,” but “use VPD/temperature/RH to prioritize scouting and choose timing for interventions.” You check results by trend, not by a single day.
2) Gerbera specifics: architecture, flower quality, and the humidity trade-off
Gerbera forms a dense rosette, with leaves close to the substrate and peduncles lifting the inflorescence above the foliage. In practice you get two microclimates: one low, near the substrate (often more humid, cooler at night), and one higher, at flower level (more exposed to radiation and air movement). For thrips this matters operationally: scouting only “at the top” or only “at the base” can miss the start of an outbreak. You observe differences between edge zones, near doors, screens, or main aisles.
Gerbera is also sensitive to quality losses: flower deformities, weaker stems, uneven opening. Here microclimate matters directly, even without thrips. Independent verification means correlating your climate graphs with batch quality: when short stems appeared, when leaves wilted around midday, or when morning condensation was seen. The practical decision is to choose risk windows that do not push you into another major risk (for example, prolonged high humidity). You check the result through harvest uniformity and fewer zones showing repeated stress patterns.
3) How to define risk windows from your own data (without “universal” thresholds)
Start with a baseline period in which you collect data and events—not settings. The mechanism is simple: first identify repeatable patterns, then set alerts. What you observe includes: (a) times of day when temperature/RH jumps quickly, (b) days with large differences between zones, (c) condensation episodes or rapid “dry-down” right after venting. Verify independently with a basic protocol: trap counts 2–3 times per week, standardized plant inspections on the same number of plants per zone, always logged with date and time.
Build candidate windows as descriptive rules, for example (hypothetical): “after midday, on days with a rapid rise in VPD and upper-canopy temperature, the door-adjacent zone shows trap increases,” or “after nights with very high RH followed by short morning heating, new rosette symptoms appear.” You do not publish the number as truth; you treat it as a hypothesis. The practical decision is to pick 1–2 windows to actively track for 3–4 weeks (long enough to cover weather shifts and harvest rhythm). You check results by the ratio of useful alerts to alerts that lead to no field findings.
4) Sensors and placement: seeing the differences that matter for thrips (and for gerbera)
For risk windows you need air temperature and air humidity (from which VPD is calculated), and sometimes it is useful to have a sense of leaf-level temperature (indirectly, by comparing points, not as a single “standard”). The mechanism: thrips and plants experience the microclimate in the canopy, not the mixed air above it. What you observe is that if a sensor sits too high, it can underestimate real variability at rosette and flower height. Verify placement with periodic audits using a handheld thermometer/hygrometer taken to the same points each time.
Place sensors in zones that have physical reasons to differ: edges, corners, near doors, under screens, along traffic aisles, near heating sources or fog/humidification outlets. Avoid promising “one sensor covers X square metres”; density depends on how uneven the house is. The practical decision is to define zones by climate behaviour, not perfect geometry. You check the result when maps show stable, repeated differences and the team confirms that those areas genuinely “feel” different and produce consistent differences in quality or pest pressure.
5) From microclimate to action: what to do when control is global but risk is zoned
In many greenhouses, ventilation, heating, or shading is controlled at compartment level, not at fine zonal level. That changes how you use alerts: they are not commands, they are prioritization. The mechanism is that if only Zone A frequently enters a risk window, it does not mean you can correct only A; it means you must reduce the A–rest gap through local measures (sealing drafts, curtain adjustments, airflow patterns, door routines) or adjust a global setpoint cautiously. You observe how large zone-to-zone differences are during the same hours.
Independent verification means logging physical interventions (for example: reducing door drafts, repositioning circulation fans, changing venting routine) and tracking whether the amplitude of zone differences shrinks. The practical decision is to start with measures that reduce local extremes without pushing the whole house into an unfavourable regime for gerbera (for example, continuously high RH or large temperature swings). You check results by: (1) shorter/rarer windows in the problem zone, (2) scouting that finds fewer repeat hotspots in the same place, and (3) more uniform harvest quality.
6) Building zone alerts: turning “values” into “work signals”
A good alert does not begin with a fixed value; it begins with an operational criterion: “is it worth sending someone to this zone to check?” The mechanism is that microclimate is noisy (vents opening, cloud breaks), while thrips management depends on repeated findings. You observe that alerts that flicker for a few rare minutes are often useless; alerts that repeat at the same hours in the same zones are more often a real signal. Verify independently by comparing alerts against the scouting log and the trap-count notes.
In GrowGuard you can set zone-based alerts using temperature/RH/VPD sensors, but you “calibrate” them from your own history: choose a minimum duration and persistence condition that captures relevant episodes rather than blips. Avoid copying thresholds from another greenhouse; use the distribution of values in your own graphs (percentiles, typical hours) and mark weeks with high trap pressure. The practical decision is to start with informational (non-critical) alerts and tighten them gradually. You check results by fewer nuisance alerts and more inspections that find something concrete.
7) Linking microclimate windows to IPM: traps, biocontrol, sprays
Risk windows are valuable when they synchronize IPM, not when they replace IPM. The mechanism is that the effectiveness of many actions depends on timing and access: traps must be read when they are meaningful, predators/entomopathogens need compatible conditions, and sprays (if used) must be applied when coverage and persistence are most reliable. You observe that if very dry-air episodes occur exactly when you apply treatments, results may vary between zones. Verify independently by logging the application time and zone conditions.
The practical decision is to use windows to plan “targeted inspections” before escalation: when an alert points to a zone, check open flowers and young leaves first, then compare with a control zone. If you find trap increases or new symptoms, intensify IPM in that sector (for example, increase trap density or scouting frequency). You check results by trend: counts return toward baseline and new symptoms become less frequent. Alerts are not pest detection; they are a trigger to verify.
8) Failure cases: when data “looks good” but the outbreak grows (or the opposite)
A common failure is assuming air-based VPD perfectly describes leaf status. The mechanism is that a sensor may sit in a different airflow, may be accidentally wetted, or may read well-mixed air while the rosette remains stagnant. You observe inconsistencies between two nearby points or abrupt changes with no operational cause. Verify independently with a sensor audit (position, shielding, cleanliness), comparison to a handheld instrument, and coherence checks against other temperature/RH points in the greenhouse. The decision is to fix measurement first, not “fix the crop.”
A second failure is confusing correlation with cause: if an outbreak appears after a week with certain values, that does not mean those values produced it. It may be planting material, introduction via aisles, host weeds, or a zone handled more often. You observe hotspots that follow traffic paths rather than climate maps. Verify independently by checking worker routes, crate storage, door habits, and nearby ornamental plants. The practical decision is to keep alerts as a prioritization tool but add a “biosecurity checklist” when a zone triggers repeatedly. You check results by reduced reappearance in the same zone after physical measures.
Conclusion
Linking VPD, temperature and humidity to thrips “risk windows” in greenhouse gerbera works only if you treat it as a learning process: define hypotheses, verify in the crop with traps and inspections, and adjust until alerts send the team exactly where it is worth looking. Air-based VPD is not the leaf and not the pest; it is a microclimate dynamics indicator that becomes useful when validated on your own batches.
Once your windows are clearly formulated and zones are stable, you can set zone alerts to reduce delayed reactions and avoid “whole-house” interventions. If useful, use GrowGuard as a climate and alerting log, then close the loop with consistent field checks and a monthly threshold review based on history and greenhouse findings. For zone commissioning and configuration, request a demonstration adapted to your compartment layout.