Dianthus (carnations) are valued for flower quality, yet the petals can quickly reveal microclimate issues: spots, discoloration, mottled edges, or blooms that brown after a humid spell. In a greenhouse, the trigger is rarely a single factor; most often low VPD, condensation, and ventilation that fails to reach critical pockets overlap in time and space.
If you track only relative humidity, you can miss the moment when buds and petals become truly wet. And if you rely on what it “feels like” at the door, you can overlook a cold corner or a still aisle where Botrytis gets its window. A practical solution is to connect drying indicators (VPD), wetness signals (condensation/leaf wetness), and the response (ventilation/heating/operations) into zone-based alerts.
The protocol below explains the mechanism, what to observe directly in the crop, what to verify independently (to avoid false alarms), what decision to take the same day, and how to confirm the intervention actually shortened wetness time. The focus stays on Dianthus microclimate practice, not fixed “recipes” or universal setpoints.
1) Why Dianthus petals spot when VPD is low and condensation forms
In Dianthus, marketable quality depends on clean petals and buds opening without distortion. When VPD stays low, transpiration slows and floral surfaces dry slowly after any water source: fine mist, spray droplets, internal “dew,” or condensation dripping from structures. As air temperature drops toward dew point, water deposits on petals and the calyx; micro-droplets can leave spotting or support opportunistic infections such as Botrytis.
Watch how it develops in real greenhouse time: risk usually increases late at night and early morning, when the air layer above the crop cools and circulation is weak. Verify independently by gently touching leaves/buds in suspect zones, looking for a sheen of moisture, and tracking where first symptoms appear 24–48 hours later. The practical decision is not “more air” in general, but shortening the period petals stay wet via targeted air movement and controlled temperature difference. Confirm by seeing shorter condensation-risk duration in the same zones.
2) What to measure to connect VPD, condensation and ventilation without confusion
VPD is calculated from air temperature and relative humidity, so it estimates the air’s drying power; it is not a direct measurement of the leaf or petal. In carnations, the difference between leaf/petal temperature and air temperature can matter: a bud can be cooler than the surrounding air, especially under clear skies (radiative cooling) or near cold surfaces. That is why a “good” VPD on paper does not guarantee no condensation, and a low VPD does not automatically mean wet leaves—only higher risk.
To capture real wetness risk you need an additional signal: a condensation/leaf-wetness indicator, or a dew-point logic (temperature + RH) tied to cold zones. Also treat ventilation as an effect, not an intention: opening vents is meaningless if air does not move at flower level. Verify independently with simple moisture-sensitive paper strips or fixed-time crop inspections. The practical decision is to build alerts that trigger on combinations (low VPD + condensation risk), not on a single value. Confirm by comparing event duration across zones.
3) Zone alerts: why one “central” sensor misses Botrytis corners
In carnation houses, microclimate differs between rows, gable ends, near doors, along cold walls, under gutters, or near screens. Botrytis does not need the whole greenhouse to be “perfectly humid”; it needs one zone that stays wet long enough, especially if plant debris or infected material is present. That is why zone alerts are more useful than a single global threshold: they show where the risk window forms and where the response must be applied.
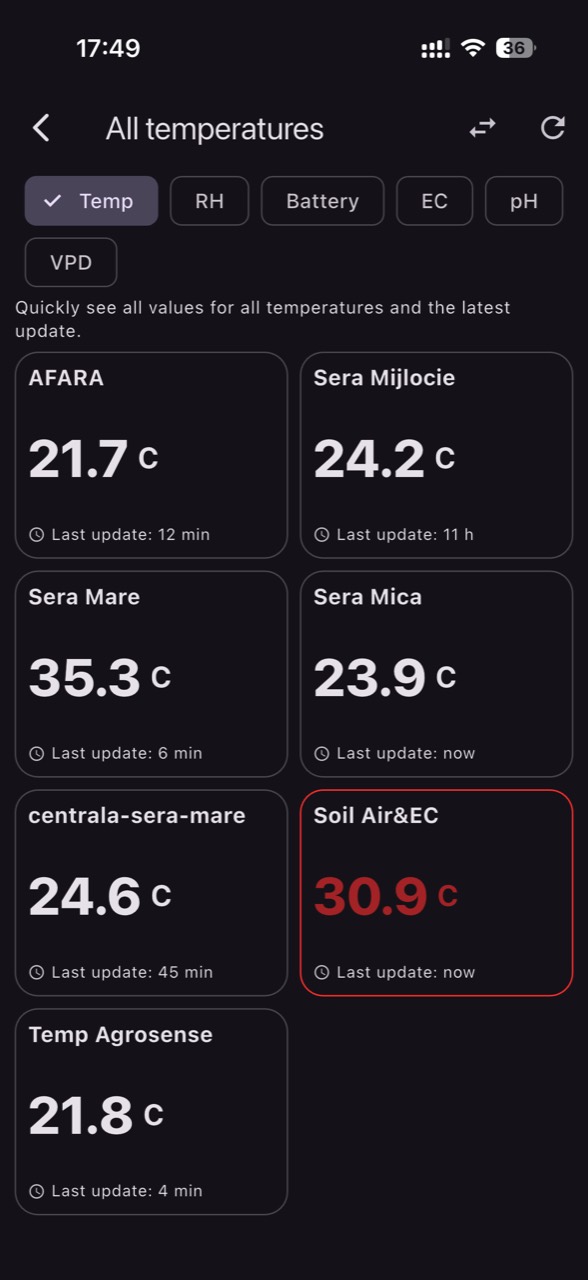
Observe where the first spotted flowers appear; they often coincide with weak air movement or temperature differences between aisles. Verify independently by walking a handheld thermo-hygrometer at bud height across two or three points and comparing to the fixed sensor; persistent differences point to a zoning need. The practical decision is to divide the house into operational zones (not only geometric blocks) and set different alert logic where events repeat. In GrowGuard, separate zone alerts and a sensor map help avoid treating the “symptoms” in the wrong part of the house.
4) Sensor choice and placement: measure at flower level, not at the roof
For VPD and condensation risk in Dianthus, placement usually matters more than catalogue accuracy. Mount temperature/RH sensors in the canopy zone near flower level, shielded from direct heater jets and sun. A sensor beside a unit heater can report “excellent” VPD while buds in a corner remain wet. Also don’t mix sensor types: temperature/RH sensors do not measure EC or pH; those require dedicated probes in a defined medium (water, fertigation solution, substrate extract).
Watch for common placement failure modes: thermal screens and curtains create air layers; a sensor mounted too high sees “mixed” air rather than stagnant air between plants. Verify independently by comparing 3–7 days of a zone sensor trend to a reference point; if the difference shows mainly at night, stratification is likely. The practical decision is to install at least one measurement point in historically spotted zones and one in a consistently “good” zone as a control. Confirm that after adjustments the zone gap shrinks or the low-VPD duration decreases where it matters.
5) Commissioning protocol: turn graphs into alerts that trigger actions
A good commissioning protocol starts by defining events, not numbers: “long periods of weak drying air,” “repeated approaches to dew point,” “condensation detected at dawn.” Use duration-based alerts (a condition maintained for a period) to avoid minute-to-minute noise. Data must be fresh enough for the decision rhythm: for night/morning management, long delays reduce value; also watch sensor status/battery alerts so you don’t trust a failed device.
During the first two weeks, observe how many alerts are truly actionable; too many usually means the threshold/duration is wrong or the sensor is poorly placed. Verify independently: when an alert comes in, do a short in-zone inspection and note whether petals are cool/damp or droplets are visible on structures. The practical decision is to tune placement and logic first (VPD plus dew-point/condensation), and only then adjust thresholds. In GrowGuard, keep the logic differentiated by zone: a good alert should lead to a specific, checkable action.
6) Ventilation as the response: avoiding “venting that cools and wets even more”
Ventilation lowers absolute humidity only if you bring in drier air or exhaust humid air without dropping surfaces below dew point. In carnations, abrupt venting in cold weather can cool buds quickly, increasing condensation risk right on the petals. Watch the context: at dawn, outside air can be cold and humid, so opening vents wide can backfire unless you maintain minimum heat input or internal circulation that raises surface temperature and breaks up the still layer within the crop.
Verify independently after an intervention: did temperature fall more than RH fell, and did dew point remain close to canopy air temperature? A practical (hypothetical) decision: if a condensation-risk alert arrives at 05:30, instead of a large vent opening you choose staged venting while increasing internal air movement, then reassess after 15–30 minutes. Confirm results by shorter time flagged as condensation risk and visibly drier buds in that zone.
7) Condensation doesn’t come only from the air: irrigation, sprays, and debris
In greenhouse practice, plant wetness can also come from operations: overhead irrigation, wash-down, late-day pesticide/fogging applications, or leaks that increase local evaporation. In Dianthus, any water on the flower before night can leave marks or prolong wetness in the calyx. Also, plant debris and incoming plant material can maintain inoculum; microclimate only indicates conducive conditions, not the presence of a pathogen or a confirmed diagnosis. Moisture control must therefore be paired with hygiene and residue management.
Observe whether repeat-spotting zones coincide with row ends where water spills or where dead leaves accumulate between plants. Verify independently by inspecting under the canopy for old leaves, fallen blooms, and permanently wet substrate patches; note whether condensation events follow “wet work” days. The practical decision is to reschedule wetting operations earlier, isolate leak zones, and improve targeted cleanup. Confirm by seeing both shorter wetness windows and fewer repeat spotting events in the same physical points.
8) Proving the alerts reduced risk: audit by events, not impressions
To know whether your VPD–condensation–ventilation link is working, evaluate repeatable event types: “cold clear nights,” “foggy mornings,” “periods of heavy canopy load.” Use history to measure cumulative duration of risk intervals per zone before and after changes. Don’t chase perfection; the goal is to shorten the long windows that allow persistent wetness on flowers. One brief VPD dip does not carry the same meaning as 4–6 consecutive hours.
Verify independently with a simple protocol: at the next major alert, take hypothetical photos in the same zone at 0, 30, and 90 minutes after intervention and note visible wetness on buds. Cross-check with symptoms: if spotting persists, you may have a source issue (debris, planting material, water) or an uninstrumented cold pocket. The practical decision is to refine zoning, sensor placement, or alert logic—not simply “raise the threshold.” In GrowGuard, historical reports help you compare the same night types week-to-week objectively.
Conclusion
In Dianthus, reducing Botrytis pressure and petal spotting is largely about how quickly you move from “humid air” to “dry surfaces” in the exact zones that stay cold and still. VPD tells you how much the air can dry, condensation risk tells you when petals are likely to get wet, and ventilation only helps if it changes those two realities at flower level. Combine indicators, work with duration, and always verify in the crop—not only on charts.
To operationalize this, start with two or three problem zones plus one consistently “good” control area, then run a short audit after each night/morning event. Adjust sensor placement before you adjust thresholds, and keep interventions small but checkable. If your team needs zone alerts and comparable history across microclimates, GrowGuard can serve as the monitoring platform; treat automation as a separate project and validate it with measurements and inspections.