Cut-flower alstroemeria demands firm stems and healthy foliage over a long cycle with repeated harvests. Two issues often show up together: Botrytis (especially in dense foliage and shaded spots) and soft stems that flop or bend. Both are strongly shaped by how you synchronize substrate water with the greenhouse microclimate.
If you irrigate “by schedule” or only by how the substrate feels, you can push the crop into a risky combination: wet substrate + near-saturated air + cool nights. Under these conditions, leaves can stay wet for hours from condensation, and tissues tend to stretch and soften. The key is not a universal setpoint, but the link between water, VPD, and condensation windows.
This article explains the mechanism, what is worth measuring, and how to independently verify that your sensor interpretation is correct. You’ll see a practical commissioning protocol: which sensors to choose, where to place them, how to turn readings into actionable alerts (including in GrowGuard), and how to check after an intervention whether you reduced Botrytis risk without over-drying the plants.
1) Why Botrytis and soft stems appear at the same time
Botrytis needs free water on surfaces (leaves, petals, crop debris) and a “lazy” microclimate with humid air and weak circulation. In alstroemeria, the canopy becomes dense; inner leaves dry slowly after irrigation events or after a cool night. Condensation forms when the leaf (or any surface) cools below the air’s dew point, even if you never wet the foliage directly.
Soft stems are often a sign the plant has grown with limited transpiration and more “watery” tissue. When VPD is low (air close to saturation), transpiration drops, and water/nutrient uptake and transport shift; low light and poorly matched temperatures can further promote elongation. Observe: longer, less rigid stems, persistently damp foliage, and spotting or gray mold on older leaves. Independently verify by checking inner leaves early morning for moisture and tracking whether symptoms start in stagnant-air zones. Practical decision: don’t automatically “cut irrigation”; link water reductions to shortening wet-leaf windows. Check the result by comparing condensation-risk duration before/after and stem firmness at the same harvest age.
2) What VPD means—and why it’s not enough on its own
VPD (vapor pressure deficit) is calculated from air temperature and relative humidity; it estimates how strongly the air can pull water from the leaf. In a greenhouse, VPD can look acceptable at the sensor location while the leaf is cooler (night radiative cooling, proximity to walls/vents/screens), pushing local conditions toward condensation. That’s why VPD is an excellent trend indicator, but it does not guarantee leaves are dry.
In practice you watch two signals: extended low-VPD periods and indications that surfaces are reaching the dew point (condensation). Observe: morning differences between zones (corners, near doors, under screens), leaves with a water sheen or fine droplets. Independently verify by comparing VPD to a visual inspection inside the canopy and occasional leaf-temperature checks with an IR thermometer (verification only, not automation). Practical decision: if condensation repeats, adjust the drying strategy first (ventilation/heating/airflow), then recalibrate irrigation so you’re not adding substrate water right before the typical condensation window. Check the result by monitoring whether RH “peaks” and very low-VPD episodes shorten and whether foliage dries faster after sunrise.
3) Substrate: the “invisible” water that keeps air humidity high
In substrate-grown alstroemeria (bags, pots, gutters), roots occupy a limited volume, and a small excess can keep pores water-filled and reduce aeration. The outcome is not only root-zone stress; it can also be slow, continuous evaporation that elevates humidity within the canopy. On cool days, when ventilation is reduced, evaporation from the substrate can be enough to push nights toward saturation and condensation.
Observe: substrate staying “heavy” long after irrigation, any anaerobic odors, or lower leaves yellowing without a clear nutritional explanation. Independently verify by randomly lifting a few bags/pots to compare mass, checking actual (not assumed) drainage, and inspecting water distribution through the volume (drippers can wet only a narrow zone). Practical decision: adjust timing and break irrigation into pulses so the substrate has time to re-oxygenate before night, without forcing midday water stress. Check the result by looking for a clearer “wetting–controlled dry-down” rhythm in root-zone readings and fewer nights with near-saturated air.
4) Sensor selection: what you measure, in which medium, and in what units
For this problem you need two measurement families: microclimate (air temperature + relative humidity, for VPD and condensation risk) and root zone (substrate moisture; optionally substrate temperature). Important: a temperature/RH sensor cannot measure EC or pH; those require dedicated probes, and EC in fertigation solution is not the same as EC extracted from the substrate. Whenever you compare EC, always state the medium and method: irrigation water, nutrient solution, substrate extract.
In the data, watch sampling frequency and freshness (sparse or delayed data can miss the exact condensation moment). A VPD value calculated every 30–60 minutes can miss short saturation spikes; substrate moisture changes more slowly and can be tracked at longer intervals. Independently verify at commissioning: compare air temperature/RH to a reference instrument at the same point; for substrate sensors, validate with a simple “known irrigation” check—irrigate, then confirm the sensor shows a logical rise and subsequent decline. Practical decision: start with robust climate sensors by zone and at least one representative substrate point for each irrigation zone that behaves differently. Check the result after 7–10 days: if graphs show no differences between zones that clearly behave differently in reality, revise placement or sensor type.
5) Correct placement so microclimates don’t fool you
In alstroemeria, the Botrytis risk zone is not always where a nicely mounted sensor on a post sits. Dense canopy, aisles, greenhouse edges, and areas under screens create microclimates. Place the air sensor at a height relevant to the foliage, protected from direct heater/vent jets and direct solar radiation. If you rely on a single climate point for the whole house, you can miss the corner where condensation starts first.
For substrate sensors, wrong placement creates the costliest wrong decisions: too close to the dripper reads “always wet,” too far reads “always dry.” Observe: visible non-uniformity (more vigorous plants at one row end, darker leaves, localized mold). Independently verify by temporarily relocating a sensor (hypothetically for 48 hours) into a suspect area and comparing trends, and by physically checking moisture at 2–3 depths in the same container. Practical decision: define crop/irrigation zones based on reality (orientation, proximity to doors, bench type, canopy density) and install one “truth point” in each. Check the result: if alerts always occur in the same zone and scouting confirms wet leaves, you’ve identified a real zone problem—not a “false alarm.”
6) A correlation protocol: from charts to an irrigation decision
Correlation is done in sequences, not absolute values. On a typical day, note (1) when irrigation starts, (2) how fast substrate moisture rises, (3) what happens to air humidity and VPD over the next hours, and (4) whether the night approaches the dew point. If you see that a late irrigation raises evening humidity and extends low-VPD time, irrigation is indirectly contributing to risk—even without foliar wetting.
Independently verify you’re not confusing cause and effect. For example, rising humidity may come from reduced ventilation rather than irrigation, so mark operational events (vents opening, heat on, screens closing). Practical decision: shift part of the irrigation volume earlier in the day (hypothetically 1–2 hours before the usual temperature drop window) and watch whether night-time condensation-risk time shortens. Check the result: a good graph outcome shows the substrate reaching the intended moisture earlier while air does not remain “stuck” near saturation after sunset; on-crop, inner leaves should be drier in the morning.
7) Alerts that help: thresholds on trend and duration, not “panic”
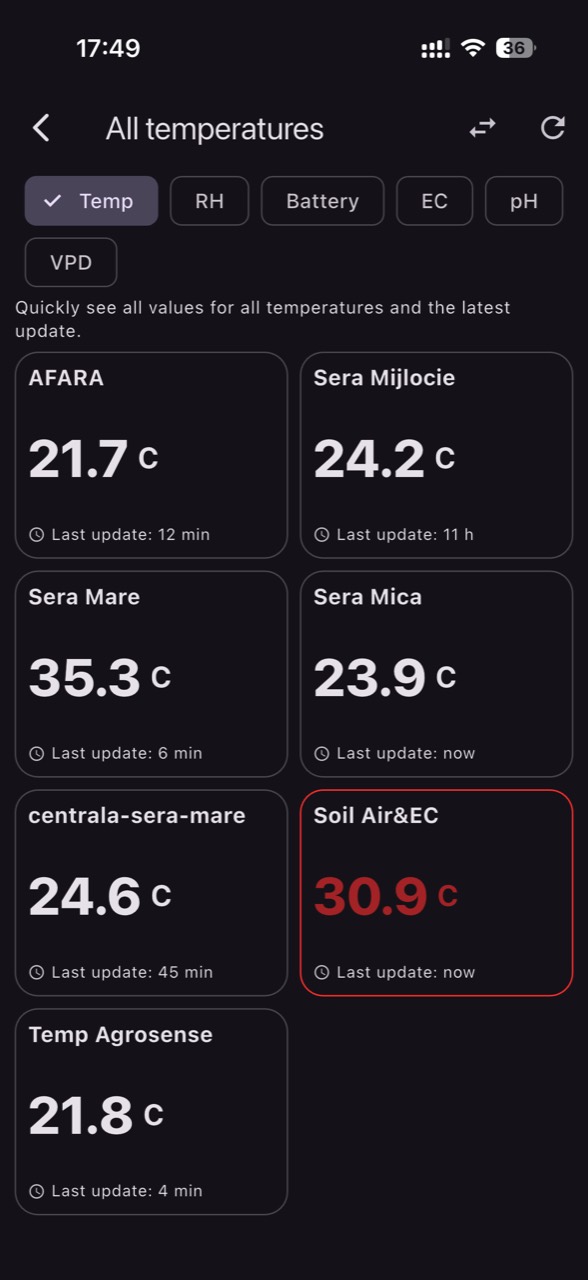
Useful alerts for Botrytis and soft stems are built on duration and context. A brief spike in high RH is not the same as 3–5 hours of near-saturated air in a shaded zone. Set alerts that flag a “risk window” (for example, very low VPD or persistent approach to saturation) and separate those from substrate alerts (moisture too high for too long, or an overly fast daytime drop). In GrowGuard, use zone-based alerts so the team knows where to check, not just that “the greenhouse is humid.”
Observe whether alerts arrive when the team cannot act (for example at night) and no clear response protocol exists; that leads to alert fatigue. Independently verify after a climate-risk alert by going to the indicated zone and confirming visually: wet leaves, condensation on structure, foliage clumping. Practical decision: define two standard reactions—(a) scouting plus drying measures (airflow, ventilation/heating strategy) for climate alerts; (b) irrigation/pulse review for persistent saturated-substrate alerts. Check the result: after 1–2 weeks, the share of “confirmed” versus “unconfirmed” alerts should rise; if it doesn’t, adjust thresholds or sensor placement.
8) Independent checks: the pathogen is not “in the graph,” and water has multiple sources
Microclimate readings show conducive conditions, not certain pathogen presence, and not a confirmed diagnosis. Botrytis can persist in plant debris, planting material, or be maintained by weak hygiene; irrigation and microclimate mainly open or close windows where symptoms can escalate. Observe: aging leaves retained in the canopy, debris on the floor, excessive density, weak circulation. Independently verify with scheduled scouting in flagged zones, crop hygiene checks, and symptom history after operations (defoliation, harvest). Practical decision: treat an alert as a scouting trigger, not proof; record what you find as a team so thresholds can be tuned to reality.
Similarly, a “water problem” isn’t only volume: irrigation water can bring salts, unsuitable pH, or variability that affects growth and can contribute to soft stems via root stress. On-site pH/EC monitoring complements—not replaces—laboratory analysis, and EC measured in fertigation solution is not equivalent to EC from a substrate extract. Observe: sudden day-to-day EC/pH swings, symptoms after a change in water source or recipe. Independently verify with periodic water analysis and a consistent substrate-check method. Practical decision: if soft stems coincide with water/fertigation changes, investigate solution stability and drainage first, then adjust irrigation. Check the result by tracking whether growth rhythm normalizes and whether “waves” of sensitivity during low-VPD periods diminish.
Conclusion
In alstroemeria, reducing Botrytis pressure and producing firm stems is not solved by a single irrigation setting or a single climate indicator. It comes from correlation: substrate moisture should support transpiration during active hours, while the microclimate avoids long wet-leaf windows from condensation. Sensors show the sequence; the crop confirms whether the decision was right.
To turn this correlation into a team routine, use zone-based alerts and short, repeatable checks: confirm in the canopy, adjust irrigation timing, then track the effect through the next cool nights. In GrowGuard, keep thresholds robust enough to trigger action, not fatigue. If you want help commissioning sensors and refining alerts for your specific greenhouse compartments, request a configuration review adapted to your real zoning.