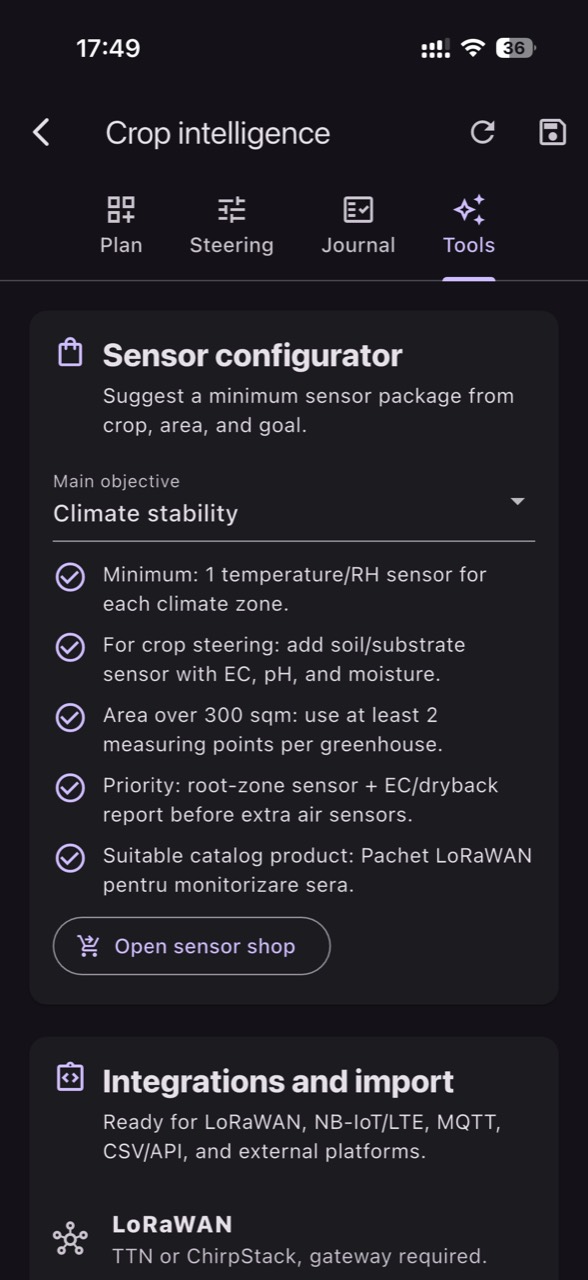
In a farm, greenhouse, or plantation, sensors are not the “goal”—they are tools for decisions: when to irrigate, how much to ventilate, whether fertigation is drifting, or where a risky microclimate is forming. That is why selection starts with the right question: which variable best explains the problem you want to control, in what medium it must be measured, and how often you actually need data.
Most failures do not come from a lack of technology, but from a mismatch between sensor and context: pH measured at the wrong point, EC compared across different media, a soil-moisture probe installed too close to the dripper, or an excellent sensor that reports too rarely to capture a short event. A good sensor becomes less useful if it is placed badly, sends too rarely, or is not connected to a practical decision.
Connectivity is also part of measurement: if the payload is interpreted incorrectly, if coverage is unstable, or if you do not track battery and status, the data can look “fine” until the day you need it. Below is a technical guide: the mechanism behind each sensor type, what to watch, what to verify independently, and a commissioning workflow for projects using LoRaWAN, NB‑IoT, or MQTT.
1) Start from the decision, not from the protocol or a sensor shopping list
The mechanism is straightforward: a good decision needs a variable that is sensitive to the problem and data that is fresh enough to act on. For water stress, moisture in the root zone responds directly to irrigation; for salinity stress, EC in fertigation solution or in a substrate extract tells a different story than EC in bulk soil. For diseases, microclimate (temperature, humidity) indicates risk conditions; it does not identify a pathogen.
What to observe: the moments you lose control (for example, afternoon wilting, marginal burn, persistent condensation). What to verify independently: field notes, periodic water/soil/substrate analysis, and a one-off manual measurement as a reference point. Practical decision: define 2–3 actions you can take (irrigation, ventilation, solution correction) and link each action to a measurable indicator. Check the result by comparing before/after in sensor history and in crop observations, by zone.
2) pH sensors: where you measure matters as much as the probe
pH describes acidity, but the “medium” might be raw water, fertigation solution, drainage, a substrate extract, or a soil suspension. Mechanism: pH influences nutrient availability and the stability of some mixes; fast swings usually happen in water/solution more than in bulk soil. Even a high-quality pH probe can produce wrong readings if it is dehydrated, contaminated, or installed where mixing is poor and the sample is not representative.
What to observe: large same-day fluctuations, readings that appear “stuck” at a limit, or unexplained differences between irrigation lines. What to verify independently: calibration with buffer solutions following the manufacturer’s instructions and a manual check on a correctly collected sample (hypothetical example: sampling from the same line after dosing has stabilized). Practical decision: correct the process (mixing, injection point, stabilization time) before making aggressive chemical corrections. Check the result through trend stabilization and by correlating with nutrition symptoms—without confusing pH with individual nutrient concentrations.
3) EC sensors: compare only measurements from the same sample type
EC measures electrical conductivity—an indicator of total soluble salts, not “how much nitrogen” or “how much potassium.” Mechanism: EC rises with total ion concentration, but interpretation depends entirely on where you measure. EC in raw water, in fertigation solution, in drainage, in a substrate extract, or in soil are different measurements with different dynamics; this is why on-site pH/EC monitoring complements laboratory analysis rather than replacing it.
What to observe: EC looks stable in the tank, yet plants show stress; or EC appears “perfect” in the line, while drainage suggests another picture (hypothetical example). What to verify independently: consistent sampling (same point, same method), a temperature check (many probes compensate, but not all in the same way), and a comparison to a handheld conductivity meter. Practical decision: if EC in the solution is correct but root-zone EC climbs, first examine irrigation frequency and leaching fraction rather than changing the “recipe.” Check the result by confirming EC decreases in the root-zone medium and vigor improves in the same monitored zones.
4) Soil/substrate moisture: placement determines what the data means
Moisture sensors (especially volumetric ones) react to water changes in the root zone, but they can mislead if they are not installed in a representative volume. Mechanism: localized irrigation creates a wet bulb with strong gradients; placing a sensor too close to a dripper shows sharp spikes, while too far away can show “drought” even when plants are fine. In substrates, structure and salts can influence some measurement technologies, so compatibility with the medium matters.
What to observe: curves that do not show irrigation cycles at all, or exaggerated peaks that do not match plant response. What to verify independently: a quick digging inspection (texture, root depth), a simple correlation test after irrigation (it should rise, then decline gradually), and a comparison between two nearby points to reveal variability. Practical decision: adjust location or depth before changing the irrigation program. Check the result by seeing curves that align with events (irrigation/rain) and by improving uniformity across zones—not by chasing a universal “ideal” value.
5) Climate and microclimate: temperature, humidity and VPD are the language of stress
Air temperature and humidity sensors describe the air around the plant; from them you can estimate VPD (vapor pressure deficit). Mechanism: VPD connects transpiration to the air’s capacity to absorb water vapor; when the air is too dry or too humid, the plant changes behavior (stomata, cooling, water use). Important: VPD is an estimate based on air temperature and relative humidity; leaf temperature may differ, especially under strong radiation or airflow.
What to observe: morning condensation, abrupt humidity swings, or cold spots inside a tunnel/greenhouse. What to verify independently: a portable thermometer/hygrometer for spot checks in 3–5 locations and a visual review of airflow paths (doors, sidewalls, fans). Practical decision: adjust ventilation, shading, or heating based on trends rather than a single spike. Check the result by reducing the duration of high humidity/condensation and stabilizing microclimate by zone, correlated with lower disease pressure (risk conditions, not detection).
6) Connectivity: LoRaWAN, NB‑IoT and MQTT solve different problems
A protocol is not an “upgrade” by itself; it is a fit between coverage, power use, and integration needs. LoRaWAN can work well with a gateway and long-range coverage, but demands attention to antenna placement and signal quality. NB‑IoT uses an operator network and can be useful for remote farms, but depends on local coverage and SIM policy. MQTT is often used for automation and data integration, but requires careful management of connections and topics/payload interpretation.
What to observe: missing series (data gaps), long delays, or payloads that do not translate cleanly into units. What to verify independently: the sensor’s transmission log (if available), signal level at the real mounting location, and a comparison between measurement time and reception time. Practical decision: choose LoRaWAN when you can control infrastructure (gateway placement), NB‑IoT when you need autonomy without a gateway, and MQTT when integration with existing systems is the priority. Check the result by stability: percent of packets received, latency that matches your decisions, and predictable battery consumption.
7) A 10-step commissioning workflow: from box to usable data
1) Define variable, medium, and unit (pH in solution, EC in drainage, moisture in soil at depth X). 2) Choose frequency: often enough for the relevant events (short irrigations, humidity peaks). 3) Test signal before final installation. 4) Mount temporarily for 24–72 hours and watch for plausible cycles. 5) Calibrate/validate pH and EC as the manufacturer requires; do not assume “factory” is enough for field conditions.
6) Verify freshness: timestamp, send interval, and any buffering behavior. 7) Confirm payload interpretation: scaling, sign, temperature, battery. 8) Document each sensor on a map and within its crop zone (greenhouse, block, row, depth). 9) Set alerts only after you have a minimum history and have seen normal variability. 10) Run an intervention test (hypothetical example: one controlled extra irrigation) and confirm the response; if the data does not show it, the issue is placement, frequency, or connectivity—not “the crop.”
8) Typical failures and errors: separating a real crop issue from a data issue
Error mechanisms have recognizable patterns: “frozen” values (stuck sensor), impossible jumps (connector issue, water ingress), slow drift (aging, deposits), or missing data in waves (network, gateway, battery). pH/EC commonly fail from maintenance mistakes (cleaning, storage), while climate sensors often fail from bad placement (direct sun, next to heat sources, in a draft). In soil, poor installation can leave air gaps and cause misleading readings.
What to observe: an alert that does not match field reality, or plant symptoms with no signal in the graphs. What to verify independently: a manual measurement, a physical inspection of the installation, and a check of the last transmission. Practical decision: treat data quality first—reposition, clean, recalibrate, change transmit interval, or move the gateway. Check the result by returning to natural-looking curves and reducing “false alarms.” In platforms such as GrowGuard, status/battery alerts and zone history can help separate an agronomic problem from a connectivity problem—without confusing monitoring with automation itself.
Conclusion
The right sensors are the ones that measure the right variable in the right medium, at the right frequency, with stable connectivity. pH and EC require dedicated probes and disciplined validation; soil moisture requires careful placement; climate requires thinking in microclimates rather than single values. And when you compare data, compare only measurements made by the same method and at the same point in the process.
A commissioning workflow, plus periodic independent checks, helps you build data you can actually use—for irrigation, fertigation, ventilation, and risk scouting. If you want to visualize sensors by zone and receive practical alerts for pH/EC/moisture/climate and sensor status, GrowGuard can be used as a monitoring platform to interpret data from LoRaWAN, NB‑IoT, or MQTT.