Energy is one of the largest cost lines in greenhouses and tunnels, and pressure on budgets rises exactly when agronomic risk is highest: cold nights, variable radiation days, high humidity, and short ventilation opportunities. In practice, two mistakes drive big bills: uniform settings across the whole site and decisions based on “feel” instead of data.
The key to cutting energy costs without putting the crop at risk is a repeatable workflow: measure correctly by zones, set differentiated thresholds by time windows, track temperature–humidity–VPD correlation, receive actionable alerts, and validate in history whether interventions achieved the intended effect. GrowGuard helps you see microclimate live on a sensor map, correlate parameters, monitor sensor health, and generate reports for energy audits and team decision-making.
Below is a practical guide for owners and managers of greenhouses, flower and vegetable farms, as well as orchards, vineyards, and sensor distributors implementing monitoring and automation projects.
1) Start with the right question: “Where am I losing energy, and why?”
Cost reduction begins by separating unavoidable losses from “operational” losses (setpoints, timing, routines). Energy is mainly used for heating, ventilation (fans, automated vents), dehumidification, air circulation, irrigation pumping, and sometimes lighting. In tunnels, fast temperature and humidity swings often trigger reactive open/close behavior that can consume more energy than a stable strategy.
A simple operational audit starts with three questions: 1) Which zones are cold/hot and wet/dry? 2) When do extremes occur (night, early morning, after irrigation, before sunset)? 3) Do interventions (heating, ventilation, screens, circulation) reduce agronomic risk, or do they simply shift the problem to another zone?
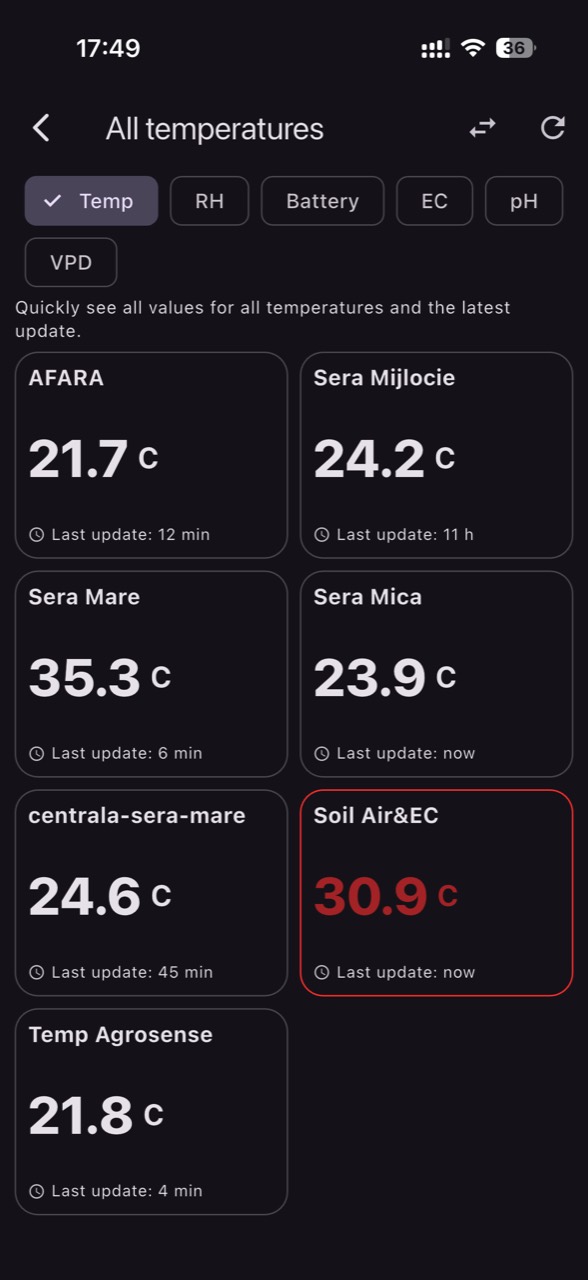
GrowGuard supports this step through live greenhouse sensor monitoring, a sensor map, and quick access to historical charts. Instead of assuming the site is uniform, you can see real differences between ends, rows, compartments, or tunnels.
2) Measure what matters for energy and risk: temperature, humidity, VPD, and the “context”
For safer energy decisions, temperature and humidity are not enough on their own; their relationship, expressed as VPD (vapor pressure deficit), is often more useful for judging stress and condensation risk. “Warm and humid” air can still have low VPD and a high condensation/disease risk even when temperature looks “fine.”
A minimum microclimate set includes: air temperature, air humidity (RH), and calculated VPD. For irrigation decisions and vegetative balance, add soil/substrate moisture, EC, and pH (especially for vegetables, flowers, seedlings). In mixed spaces or tall structures, measuring at two heights (leaf zone vs. upper zone) can also be valuable.
Don’t ignore the “context” that makes data actionable: battery and sensor status, signal quality, and sampling interval. GrowGuard shows sensor/battery status so you don’t make decisions on missing data and supports integration via LoRaWAN, NB-IoT, MQTT, and TTN API imports for projects that build on existing infrastructure.
3) Split the site into real zones, not administrative ones
One of the fastest energy wins comes from correct zoning. Real zones are not just “Tunnel 1” and “Tunnel 2.” They can be: near doors, near exterior walls, row ends, under thermal screens, in draft corridors, or compartments with different canopy density.
Why it matters: if you drive heating from a single “central” sensor, you’ll overheat warm areas to bring the cold spot up to a safe threshold. Conversely, if you ventilate based on a wet zone, you can overcool other areas and then pay for aggressive reheating later.
In GrowGuard, use the sensor map to label locations accurately and validate uniformity. Create zones with agronomic logic: “cold zone,” “condensation-risk zone,” “fast-growth zone,” “post-irrigation zone.” For distributors and integrators, zoning is also the foundation for proposing differentiated thresholds and zone-based microclimate alerts.
4) Define zone thresholds: “risk thresholds,” not just comfort settings
Useful thresholds for energy savings are not only “minimum temperature 18°C.” They are risk-based: condensation risk (high RH and low VPD), stress risk (VPD too high), slowdown risk (temperature too low during critical periods).
A practical threshold set per zone includes: minimum night temperature, minimum morning temperature (after sunrise), maximum daytime temperature, maximum acceptable RH during risk windows, and minimum/maximum VPD for the crop-relevant periods. Also set alerts for fast “drifts”: sudden temperature drops or RH spikes after irrigation.
GrowGuard helps you configure threshold-based alerts for temperature, humidity, and VPD so interventions stay targeted. Instead of keeping temperature high all the time “just in case,” you can hold a safety minimum and use ventilation/recirculation strategically when VPD and RH indicate risk.
5) Add time windows: the same limit doesn’t mean the same thing at 04:00 and 14:00
Time windows are what turn thresholds into strategy. At night, the energy objective is to avoid losses and prevent condensation without overheating. In the morning, the objective is to manage the transition as radiation rises and humidity can either crash or stay stubbornly high on cloudy days. During the day, the objective is to keep VPD in a useful range for transpiration and health without thermal shocks.
Define at least four windows: night, morning (first hours after sunrise), day, and evening (before and just after sunset). For each window, thresholds can differ: for example, maximum RH at night may be stricter (to reduce condensation), while maximum daytime VPD may be capped to avoid stress.
With GrowGuard, you can watch these transitions live and verify in history whether your windows keep the crop in a stable band. For managers, this approach reduces abrupt actions that cause expensive cycles: hard venting, rapid cooling, then aggressive reheating.
6) Correlate temperature–humidity–VPD before changing the heating setpoint
A practical rule: before raising temperature “to lower RH,” check VPD and the trend over time. Yes, heating can reduce relative humidity, but if the moisture source remains (evaporation from soil, canopy, post-irrigation), you may end up with warmer air that still leads to condensation on cold surfaces or in cold zones. Also, heating without circulation can create stratification: warm/dry up high, cold/wet near the crop.
Correlation means monitoring simultaneously: 1) air temperature, 2) RH, 3) VPD, and 4) differences between zones. If one zone has very low VPD and high RH, the better intervention may be a short ventilation pulse in the right window or increased air mixing, not a large setpoint increase.
GrowGuard provides visualizations and historical traces that make these correlations obvious. When you see RH rising after irrigation and VPD dropping below threshold, you can schedule irrigation earlier, adjust duration, or ventilate during a window when heat losses are lower.
7) Build an alert workflow that reduces “alarm noise”
Alerts only help if they lead to action. If you get too many, the team will ignore them and you’ll miss the critical moment. Use a tiered approach: warning (trend), alert (threshold breach), critical alert (persistence).
Practically: set alerts on minimum VPD (condensation risk), maximum RH in the night/morning window, minimum temperature in the cold zone, and on breach “duration” (for example, only if the threshold is exceeded for more than X minutes). Add system alerts: low battery, sensor offline, suspicious jumps indicating misplacement or maintenance needs.
GrowGuard supports zone-based microclimate alerts and monitors sensor health. For larger operations or distributors managing many sites, team access matters: the right person (technician, agronomist, shift lead) receives the alert, not everyone all the time.
8) Use forecast and planning so you don’t “buy” expensive energy in panic
Many operators overspend when they react too late to weather changes: a cold front, a clear-sky night, strong wind, or a low-radiation day. When you know earlier, you can prepare: close thermal screens, adjust ventilation windows, taper target temperatures gradually, and shift irrigation timing.
Integrate forecast into the daily plan: decide in advance when you allow ventilation, when you avoid big openings, and when you accept slightly lower temperature while keeping VPD in a safer band. The goal is not perfect control; it is avoiding extremes that demand large energy corrections.
GrowGuard includes forecast so your thresholds and time windows can be applied proactively. In tunnels, anticipation reduces oscillations: fewer peaks, fewer aggressive corrections.
9) Turn data into actions: an operational checklist for the team
An effective workflow must be easy to execute on shift. Here is a practical, repeatable checklist:
1) Morning: check on the map the zones with the night’s minimum temperature and maximum RH. Note whether VPD stayed below threshold in any zones.
2) Before irrigation: check current RH and VPD; if you’re already near the limit, reduce volume or split irrigation into pulses. Use soil/substrate moisture and, where relevant, EC and pH so you don’t compensate with water for what is actually a nutrition/growth strategy issue—creating unnecessary air humidity and later energy correction. GrowGuard helps you see these values in real time, especially in intensive crops (vegetables, flowers).
9) Turn data into actions: an operational checklist for the team (continued)
3) Midday: check zone-to-zone differences; if VPD climbs too high in warm zones, look for causes (over-venting, drafts, lack of shading) before increasing irrigation. More irrigation can raise costs by driving humidity and later ventilation/heating needs.
4) Evening: plan the night based on forecast. Set a stable strategy: a controlled trajectory is usually cheaper than repeated heating–venting swings. Confirm sensors are online and batteries are healthy.
5) After interventions: verify live whether the trend changes within 15–30 minutes. If not, the action was insufficient or the root cause is in another zone. If the trend changes too much, you likely made an aggressive correction that can cost energy later. GrowGuard’s live monitoring reduces reaction time driven by assumptions.
Conclusion
Cutting greenhouse/tunnel energy costs doesn’t come from a single “lower setpoint,” but from a workflow: correct zoning, risk-based thresholds, time windows, temperature–humidity–VPD correlation, alerts that lead to action, and history verification to confirm impact. This approach helps you avoid expensive correction cycles and keep the crop within an operational safety band.
GrowGuard supports the entire process: live monitoring, sensor map, forecast, zone-based alerts, team access, reports, and history for a microclimate history for energy audit. Integration via LoRaWAN, NB-IoT, MQTT, and TTN API imports enables scalable deployments, while monitoring EC, pH, soil moisture, air humidity, temperature, and VPD connects microclimate decisions to irrigation and nutrition. Equally important for management is data quality control: battery and sensor status, so every decision is based on valid information.
Next steps: review zoning, define four time windows, choose 2–3 key VPD/RH thresholds for your highest-risk zones, and use GrowGuard history over 7–14 days to validate which changes reduce oscillations and energy use without increasing agronomic risk.