Ventilation in a greenhouse or plastic tunnel is not just “open vents when it’s hot.” Many of the expensive problems show up when the air feels “fine,” yet the microclimate quietly drives condensation, plant stress, and higher disease pressure. That’s why combining VPD + temperature + relative humidity (RH) is one of the most practical ways to make repeatable ventilation decisions.
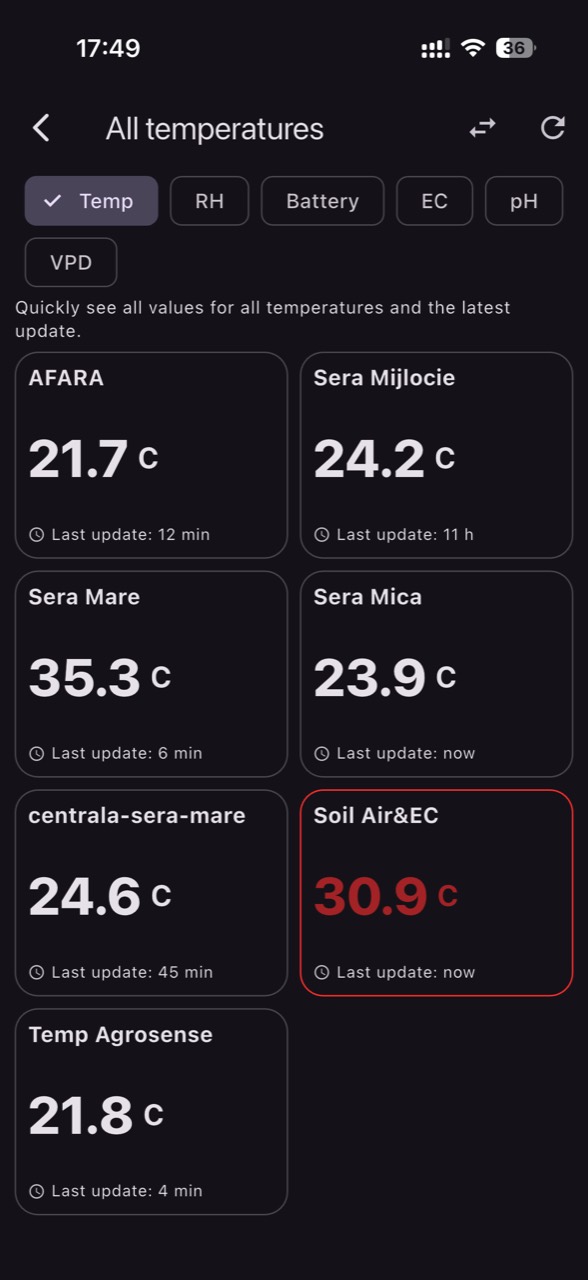
GrowGuard helps you turn sensor data into action: live monitoring, a zone sensor map, microclimate alerts, time windows (so you don’t get spammed at night), history checks, and reports your team can use. You can also deploy via LoRaWAN or NB-IoT, import data through MQTT or TTN API, and track complementary parameters (EC, pH, soil moisture, air humidity, temperature, VPD, plus battery and sensor status).
Below is a practical, step-by-step workflow for greenhouse ventilation based on VPD, with zone-based thresholds, alerts, and history confirmation—designed to reduce condensation and limit conditions that favor disease, without relying on guesswork or a single indicator.
1) Why VPD + temperature/humidity—not just “high RH = ventilate”
Relative humidity (RH) on its own can push you into the wrong decisions. 85% RH at 26°C is not the same as 85% RH at 18°C. VPD (Vapour Pressure Deficit) expresses how “thirsty” the air is for water vapor and correlates better with plant transpiration and the likelihood of condensation on leaves and structures.
Condensation forms when a surface temperature (leaf, plastic film, metal frame) drops below the air’s dew point. That means you can get “wetness” without any water entering: a small temperature drop in the evening/night, combined with moisture-laden air, can be enough. In those moments, VPD tends to fall toward very low values and RH climbs—signaling a higher-risk window for Botrytis and other moisture-favored diseases.
Temperature strongly influences both VPD and stomatal behavior. That’s why smarter ventilation tracks greenhouse temperature, relative humidity, and greenhouse VPD together, then makes decisions by zone, time of day, and recent history (trend, not just a snapshot).
2) What to measure and where: zoning, sensor placement, and greenhouse vs tunnel differences
Start with zoning. A greenhouse/tunnel rarely has one uniform microclimate: different tunnel ends, areas near doors, sidewalls, thermal screens, dense plant blocks, or irrigation zones. “Zone-based thresholds” is what prevents false alarms and avoids over-ventilating an area that isn’t actually at risk.
In GrowGuard, use the sensor map to label each zone clearly—e.g., Zone A (entrance), Zone B (middle), Zone C (far end)—plus an outdoor reference zone if you have an external sensor. For each zone, install at least one air sensor (temperature, humidity, computed VPD) at canopy level (leaf zone), protected from direct solar radiation and away from direct airflow jets.
Many operations benefit from a second sensor higher up near the ridge to capture stratification (warm, humid air accumulating above). The difference between “upper air” and “canopy air” shows whether ventilation is mixing air properly or leaving “humidity pockets.” Complementary sensors such as soil moisture and soil temperature help interpret transpiration and evaporation from soil/growbags, while EC and pH (substrate or solution) provide context when transpiration shifts (e.g., low VPD plus high EC can align with stress).
3) Define the operational goal: reducing condensation and time spent at too-low VPD
A good workflow begins with a measurable goal: reduce the duration of condensation risk and leaf wetness conditions. Practically, you track two things: (1) episodes of very low VPD (often evening/night or after irrigation) and (2) episodes of high RH combined with falling temperature, especially when the forecast indicates cooling.
Instead of chasing a “perfect number,” focus on “time spent in the risk zone.” In GrowGuard, interval history helps you see how many hours VPD stayed below your threshold overnight or across a week—and in which zones. This is more useful than a single reading because moisture-driven diseases depend on persistence.
For owners, managers, and sensor distributors, this goal translates into clear rules: if a zone repeatedly enters the risk band, you adjust ventilation strategy (opening, pulsing), irrigation management, minimum heating, or air circulation. GrowGuard becomes the shared operational layer between agronomy and execution: data, thresholds, alerts, verification, and reporting.
4) Building zone-based thresholds: a minimal set that works across most crops
A practical threshold set starts with three levels: Info, Warning, Critical. Define them per zone, because a “door zone” can swing more than a “central zone.”
Example logic (without forcing universal numeric values):
1) VPD too low: warning when VPD drops below the minimum desired for that crop and growth stage (condensation risk, reduced stomatal activity). Critical if it stays below that level for a set number of consecutive minutes or drops sharply after sunset. GrowGuard lets you base alerts on persistence and trend, not only on a single point. 2) RH too high: warning when RH exceeds a high level and persists, especially if temperature starts falling. Critical if RH remains elevated in the night window. 3) Temperature: warning when temperature approaches a level where dew point becomes problematic relative to cold surfaces (film, metal). Critical when temperature falls fast and VPD collapses in the same zone. 4) Sensor-to-sensor delta (stratification): if the upper sensor is much warmer/more humid than the canopy sensor, you risk condensation on structures and later dripping. A delta threshold helps trigger circulation/ventilation before droplets form. 5) Sensor status: battery and connectivity alerts. Good decisions require reliable data; GrowGuard can alert when a sensor stops reporting or battery drops so you don’t “ventilate blind.”
5) Time windows and “different day/night rules”: avoiding noisy alerts and wrong actions
Optimal ventilation has different rules for day versus night. By day you ventilate for temperature and CO2 management, and VPD can rise quickly. At night, the main objective is condensation prevention—avoiding long periods of very low VPD and near-saturated RH.
In GrowGuard, configure alert time windows so messages match how your team actually works. For example:
• “Pre-night” window (1–2 hours before sunset): proactive alerts if VPD is dropping fast or RH is climbing. This is when a short vent pulse or a screen/heating adjustment can prevent condensation. • Night window: alerts only for critical, persistent conditions to reduce operational noise. • Morning window: “condensation likely” alerts if history shows very low VPD overnight and temperature rises quickly (risk of dripping/leaf water film).","A common trap is reacting to a short RH spike: you ventilate aggressively, temperature drops, and VPD stays low (or gets even lower). Time windows and persistence logic (e.g., “above threshold for X minutes”) help you treat the cause rather than the symptom.
6) Smarter alerts: combined conditions (VPD + temperature + trend) and team escalation
Effective alerts aren’t numerous; they’re specific. Instead of one “RH > threshold” rule, build combined conditions that match real condensation risk:
• “Condensation risk” alert: VPD below threshold and RH high, with temperature trending downward in a zone. This combination signals you’re approaching dew point on surfaces. • “Post-irrigation risk” alert: RH rises quickly in a zone right after an irrigation event or after soil moisture increases (if you have soil moisture sensors). Not to stop irrigation by reflex, but to adjust ventilation/circulation over the next 30–90 minutes. • “Stratification” alert: large delta between upper and canopy sensors, indicating poor mixing. • “Unreliable data” alert: low battery or sensor offline, because it can lead to wrong decisions.
In GrowGuard, alerts can be set by zone and routed by role: owner/manager, head grower, maintenance technician, agronomy consultant. Team access reduces dependence on one person and improves response time, especially for multi-site operations.
7) History checks: confirming ventilation solved the problem (instead of moving it)
After any intervention (opening vents, turning on fans, adjusting screens, minimum heating), history checks are what turn microclimate control from “craft” into a process. In GrowGuard, review:
1) Did RH drop without crashing temperature? If temperature drops too far, VPD can remain low and condensation risk persists. 2) Did VPD improve in the problem zone? Ideally you see gradual improvement, not big “sawtooth” swings that stress plants. 3) Did the improvement happen across all zones or only one? If Zone A dries out but Zone C stays wet, you need zone-specific thresholds and actions. 4) How long did the episode last? A practical goal is reducing consecutive hours of very low VPD, especially during the night window.
Reports help you share these outcomes with staff and consultants—weekly or per crop cycle. For sensor distributors and automation integrators, history becomes operational proof: not “it feels better,” but trends, hours, zones, and event timing.
8) Add the forecast and “what happens tomorrow morning”: operational prevention, not reaction
Condensation is often a transition problem: evening cool-down and morning warm-up. That’s why forecast context matters. If a cold night is coming, the same RH at sunset can become critical later as the film and structure cool.
In GrowGuard, use forecast insight to pre-adjust your approach:
• On strong-cooling evenings: raise your sensitivity to low VPD (be more conservative) and set proactive alerts before night. • On sunny mornings after a humid night: watch the fast temperature rise plus the night history; if VPD was very low overnight, plan controlled ventilation to avoid dripping/leaf water film. • On days with high outside humidity: ventilation may not dry effectively; then it’s important to compare inside vs outside and use combined measures (internal circulation, screen management, minimum heating where available).
9) Connectivity and integration: LoRaWAN, NB-IoT, MQTT, TTN API—and why it matters operationally
Data-driven ventilation depends on measurement continuity. For large farms or multiple sites, connectivity becomes critical. GrowGuard supports deployments via LoRaWAN (private or public), NB-IoT where cellular coverage is strong, and integrations via MQTT or TTN API imports for existing hardware.
For managers, the benefit is standardization: one platform for tunnel, greenhouse, storage, or field, with consistent alert logic and reporting. For distributors and integrators, the benefit is flexibility: bring multiple data sources into one sensor map with zone thresholds and battery/sensor status for proactive maintenance.
Even when ventilation is manual or semi-automated, consistent data enables SOPs (procedures) and training: when alert X triggers in Zone Y during window Z, perform action W and verify in history after 30–60 minutes.
10) Connecting microclimate to plant health: AI-assisted phytosanitary alerts, field observations, and AI Plant ID
Microclimate and plant health are directly linked: repeated condensation and leaf wetness conditions increase disease pressure, but they do not automatically mean an outbreak will occur. What you can do is improve detection and response.
GrowGuard can support AI-assisted phytosanitary alerts that contextualize microclimate conditions: periods of high RH, low VPD, and favorable temperatures. This helps managers prioritize scouting—which zones to enter first in the morning, which tunnel blocks accumulated the most risk hours.
When the team observes symptoms, AI Plant ID can help with an initial, indicative identification to speed internal communication and documentation. In parallel, microclimate reports (greenhouse temperature monitoring, relative humidity, VPD) provide context for management decisions: ventilation, density, leaf removal, irrigation scheduling, or adjustments within an IPM program.
Conclusion
Smarter greenhouse/tunnel ventilation becomes much easier when you standardize decisions around VPD, temperature, and relative humidity—using zone-based thresholds, time windows, and alerts that account for persistence and trend. Instead of reacting to a single number, you manage the episodes that drive condensation and phytosanitary risk.
GrowGuard provides the practical tools to run this workflow: live monitoring, a zone sensor map, configurable microclimate alerts, forecast context, history checks, reports, team access, and integration via LoRaWAN, NB-IoT, MQTT, or TTN API—plus battery and sensor status. You can complete the picture with EC, pH, and soil moisture, and add AI-assisted phytosanitary alerts and AI Plant ID for faster field feedback.
The goal is not “perfection” in a day, but a consistent reduction in hours spent at too-low VPD and in condensation conditions—specifically in the zones that matter. With a clear workflow, every alert becomes an action, and every action becomes a verified outcome in your history charts.