In greenhouses, flower farms, vegetable operations, orchards, and vineyards, the time gap between “risk conditions” and “visible symptoms” is often long enough to miss the best intervention window. That’s why a good photo helps but isn’t enough: the image tells you what you can see right now, while field data tells you what has been happening continuously and what is likely to happen next.
GrowGuard brings both into one decision workflow: AI Plant ID for photo-based identification and indicative diagnosis, plus live monitoring, a sensor map, forecast, and AI-assisted phytosanitary alerts. The outcome is a practical approach to risk prevention: act on the conditions that increase the likelihood of pests and diseases, before the problem becomes obvious.
This article is written for owners and managers of horticulture operations and for agricultural sensor distributors who need a repeatable method: what to measure, why it matters, what GrowGuard helps you notice, and how sensor data turns into action.
1) Why combining photos with field data lowers operational risk
AI Plant ID (within GrowGuard AI) can suggest a likely cause or a group of issues based on how leaves, stems, flowers, or fruit look. However, many symptoms overlap: chlorosis can be nutritional, water-stress related, low-temperature stress, or an early disease signal; necrosis can come from phytotoxicity, unsuitable VPD, high salinity (EC), or biological pressure.
Field data provides the context that makes the difference between “it looks like” and “it’s likely”: air temperature and humidity, VPD, soil/substrate moisture, EC and pH, and their trends over time. If a photo shows suspicious spotting and the last 48–72 hours included high humidity, long periods of low VPD, and temperature swings, foliar disease risk becomes more credible. If, instead, humidity has been well controlled but EC has risen and soil moisture has dropped, the working hypothesis shifts toward stress and nutrition.
Practically, the combination reduces operational risk in two ways: (1) it helps you prioritize scouting where the data indicates risk, not just where something “seems off” randomly; (2) it helps you choose a better intervention (climate, irrigation, nutrition, hygiene, treatment) rather than reacting late or in the wrong direction.
2) What to measure in GrowGuard and why it matters for pests, diseases, and stress
For prevention, you don’t look only for a “symptom”; you look for the conditions that precede it. In GrowGuard, the most useful measurement sets for horticulture are:
Air temperature: affects pathogen development rates, pest life cycles, and the plant’s ability to transpire. Day/night swings can increase stress and open risk windows for specific diseases.
Relative humidity (RH) and VPD: high RH and too-low VPD mean reduced evaporation, longer leaf wetness periods (indirectly, via high RH), and a microclimate favorable to diseases. Too-high VPD means excessive transpiration, stress, burn risk, calcium balance issues, and higher sensitivity. That’s why VPD is often a more actionable indicator than RH alone, especially in greenhouses and partially controlled tunnels. GrowGuard calculates and tracks VPD to support fast climate decisions (venting, minimum heating, shading, fogging) depending on your setup. Soil/substrate moisture: staying too wet for too long favors root diseases and reduces oxygen; too dry drives stress, nutrient lockout, and vulnerability. The trend (how quickly it dries down) matters as much as the absolute value. EC and pH: EC indicates salinity/solution strength in fertigation or soil; high values can amplify marginal burns and “symptoms” easily confused with disease. pH drives nutrient availability; drifting out of range can create chlorosis and necrosis that can be mistaken for biological issues. Monitoring EC/pH alongside photos can significantly shorten plant diagnosis time. Battery and sensor status: prevention relies on continuity. A low battery or a broken data stream creates blind spots during critical periods. GrowGuard shows device status so you know whether the time series and alerts are reliable.
3) A practical workflow: from photo to “what I check” and “what I decide”
An effective workflow is not “take a photo and get an answer.” It is: photo + context + targeted verification + action + follow-up. In GrowGuard, you can structure it like this:
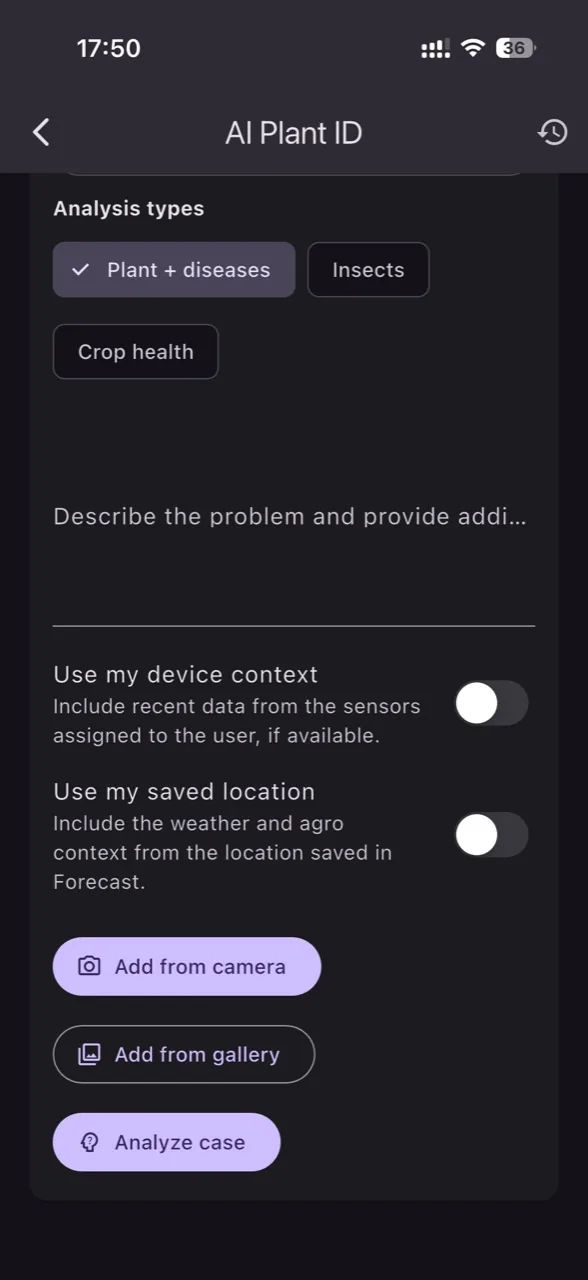
Step A: Capture photos for AI Plant ID. Take clear photos in good light with: (1) an overall plant shot, (2) a close-up of the symptom (upper/lower leaf surface), (3) if relevant, details on stems, flowers, or fruit. For pests, include areas with stippling, webbing, deformation, or residues.
Step B: Record crop, variety, growth stage, and location (greenhouse/plot/zone). In practice, the same “sign” looks different by stage, and management response differs (for example, at flowering vs. post-harvest). In GrowGuard, you can link the observation to a zone on the sensor map so it can be correlated with data later. Step C: Review the last 24–72 hours in live monitoring and charts: temperature, RH, VPD, soil moisture, EC, pH. Look for: long high-RH nights, very low VPD in the early morning, sharp oscillations, frequent irrigations with little dry-down, rising EC, or pH outside target. Step D: Compare with forecast and risk windows. Forecast helps you anticipate cold humid nights, heat spikes, or periods when ventilation will be limited. This is where preventive actions (vent earlier, slight night heat to reduce RH, screen management, dehumidification if available, irrigation adjustments) are decided before symptoms appear. Step E: Decide in layers. In many cases, the first layer is climate/irrigation (reduce pressure), then hygiene and monitoring, and treatments are the third layer when risk and evidence justify it. GrowGuard does not replace professional advice, but it helps with fast triage and with documenting the conditions that led to the issue. Step F: Set or refine alerts. If you notice thresholds are too loose (alerts too late) or too aggressive (too many), adjust thresholds/time windows so the team reacts consistently.
4) Prevention before symptoms: how to use AI-assisted phytosanitary alerts
A key advantage of GrowGuard is moving from reaction to anticipation. AI-assisted phytosanitary alerts are built on the relationship between microclimate and biological risk: certain temperature and humidity combinations, sustained long enough, increase the likelihood of infections or pest population growth. The practical idea is: when you receive a risk signal, you don’t wait to “see” the problem; you plan checks and pressure-reducing actions.
How to use it operationally: 1) When an alert arrives, first validate data credibility: sensor status, battery, and data continuity. 2) Check the map: is risk localized (one zone) or general (the whole greenhouse/farm)? The sensor map helps you avoid farm-wide decisions when the issue is confined (end rows, weak-airflow corners, persistently damp pockets). 3) Choose an action that shortens the risk window: earlier ventilation, slightly higher night temperature to lower RH, thermal screen strategy, dehumidification if available, or irrigation timing/volume changes so the substrate does not remain saturated. 4) Schedule targeted scouting: the team checks the exact zones and plants most exposed (based on the map and history), and AI Plant ID becomes the rapid confirmation tool when the first subtle signs show. 5) Document in reports: when the alert happened, what was done, what was found. Over time, reports create operational memory for the next season and support standardizing procedures. Important: alerts do not “guarantee” prevention, but they reduce surprises and increase consistency, especially in operations with many compartments or multiple teams.
5) Useful correlations between AI Plant ID and GrowGuard sensors (without confusing them for certainty)
In practice, best results come when you use AI Plant ID as a “filter” that tells you what to investigate, and the data tells you how plausible it is. Common correlations include:
Leaf spots and mildews: if the photo shows spotting, diffuse margins, or growth, check whether there were nights with high RH and low VPD. If yes, priority becomes reducing wet periods (vent/temperature/screen management) and checking canopy density/airflow. If not, look more toward phytotoxicity, salinity, or heat/cold stress.
Interveinal chlorosis: the photo may suggest a deficiency (for example iron/magnesium) or general stress. Check pH (which can lock out iron), EC (which can affect uptake), and soil moisture (which influences availability). Nutrition adjustments are more defensible when supported by these readings, not just by appearance. Marginal burn and necrosis: can be nutritional (high EC), climatic (too-high VPD), or driven by irrigation swings. Data helps you choose between “correct the nutrient solution,” “moderate climate,” or “change irrigation strategy.” Pest-type signs (deformation, stippling, webbing): microclimate can accelerate cycles. If forecast points to a warm, dry period and VPD tends to rise, increase vigilance for specific pests. Alerts and history justify intensifying scouting before populations become obvious. Root disease risk: if AI Plant ID suggests stress and the plant wilts without an obvious trigger, look at soil moisture (consistently high), temperature, and EC trends. A compromised root system can mimic deficiency or heat stress; data helps you decide when to physically check roots in the highest-risk zones.
6) Turning data into action: thresholds, time windows, and team accountability
Data becomes valuable when it is tied to repeatable decisions. In GrowGuard, a practical recommendation is to define:
Operational thresholds: not only “min/max,” but thresholds that trigger an action. For example, “VPD below X for Y minutes at night” can trigger a ventilation or minimum heating check. “Soil moisture above X for Y hours” can trigger an irrigation pause and drainage review.
Time windows: many risks come from duration, not from a brief spike. Duration-based alerts (persistence) reduce false alarms and increase relevance. AI-assisted phytosanitary alerts are most useful when calibrated to your reality (crop, density, heating/ventilation system). Clear responsibilities: GrowGuard supports team access so each zone or greenhouse has accountable owners for responses. A manager can see everything, while local leads receive relevant alerts. This is critical for multi-compartment farms or for sensor distributors supporting many clients. Reports for discipline: reports are not just an archive; they validate whether procedures were followed: alert → check → action → outcome. Over time, you can adjust thresholds and reduce unnecessary interventions without letting risks grow unnoticed.
7) Integration and scaling: LoRaWAN, NB-IoT, and MQTT/TTN API imports for distributors and multi-site farms
For many operations, the challenge is not only “having a sensor,” but having a coherent network that is easy to maintain. GrowGuard supports connectivity scenarios suited to agriculture:
LoRaWAN: useful when you need many measurement points with low power and good coverage. It’s a common choice for greenhouses, tunnels, orchards, and vineyards, especially when you want to expand gradually.
NB-IoT: useful when you want cellular connectivity and fast deployment where coverage fits. For scattered locations, it can reduce local infrastructure complexity. MQTT and TTN API imports: for sensor distributors or farms with existing hardware, importing data into GrowGuard (for example from The Things Network via TTN API) helps unify live monitoring, mapping, alerts, reporting, and team access. Instead of data silos, you get one decision dashboard. In any scenario, status monitoring (battery, signal quality or continuity depending on the setup) is part of prevention. A missed alert due to a data gap can cost more than a poorly tuned threshold.
8) Implementation checklist: how to start in 2–4 weeks without complicating operations
A pragmatic way to introduce AI Plant ID + field data is to start simple and standardize progressively:
Week 1: Choose critical zones and install/validate baseline measurement: temperature, RH, VPD, plus soil moisture. Configure the sensor map so the team knows what each point represents. Verify battery and sensor status.
Week 2: Add EC and pH where nutrition is a major factor (hydroponics, fertigation, sensitive substrates). Configure initial alerts: VPD (min/max), night RH persistence, soil moisture persistence, and device status alerts. Week 3: Define the scouting procedure: when an alert occurs, who checks, what to photograph, how to use AI Plant ID, where to log the observation, and which actions are allowed without escalation. Week 4: Review reports: how many alerts occurred, how many were relevant, what threshold adjustments are needed, and which zones are consistently problematic on the map. Adjust and repeat. This cadence reduces change resistance: the team sees that alerts lead to clear decisions, not extra work with no payoff.
Conclusion
AI Plant ID is a fast photo-based plant diagnosis tool, but the real value appears when you connect it to data: temperature, humidity, VPD, soil moisture, EC, and pH, plus forecast context and a sensor map. In GrowGuard, this combination supports risk prevention: it helps you identify time windows when issues become more likely and use AI-assisted phytosanitary alerts to intervene before symptoms are visible.
With live monitoring, reports, team access, and connectivity options like LoRaWAN, NB-IoT, and MQTT/TTN API imports, you can scale the same workflow from one greenhouse to many sites or to a distributor’s client portfolio. Biology offers no absolute guarantees, but timely decisions based on early signals and a well-documented history provide a clear operational advantage.