In greenhouses, tunnels, orchards, and vineyards, fungal diseases rarely appear “suddenly.” Most of the time, the microclimate created favorable conditions hours or days earlier: high relative humidity, long periods of leaf wetness, day/night swings that trigger condensation, critical morning windows with dew or fog, and slow canopy drying.
The practical problem is that these critical windows are not always visible—and they are not uniform across a farm. One corner of a tunnel, a shaded alley, a dense row, or a low-lying vineyard block can carry significantly higher risk than the overall average.
This article lays out a repeatable workflow for monitoring downy mildew, powdery mildew, and botrytis risk without guesswork: what to measure (humidity, temperature, VPD), how to spot critical time windows, how to add forecast context, how to set zone-based alerts, and how to verify in history whether your actions reduced exposure. GrowGuard is used as an example platform combining a sensor map, live monitoring, forecast, AI-assisted phytosanitary alerts, reports, and team access.
1) Why “risk” instead of “diagnosis”: what climate monitoring can and cannot do
Climate monitoring does not automatically tell you “you have downy mildew” or “you have botrytis.” What it can do is show when the environment was favorable for sporulation, germination, infection, or disease development—and that is the window where decisions matter: ventilation, dehumidification, strategic heating, irrigation timing, and planning scouting and preventive sprays.
Fungal disease risk results from the interaction of the host (variety susceptibility, growth stage, canopy density), the pathogen (inoculum present), and the environment (RH, temperature, leaf wetness duration, VPD). Sensors cover the “environment” component extremely well and help you decide when the pathogen is more likely to gain an advantage.
A good workflow avoids two traps: (1) reacting only after symptoms appear, when time is already lost; (2) spraying too frequently “just in case.” Instead, you track exposure to critical windows, take proportional actions, and confirm those actions using history.
2) Which diseases we’re targeting and which microclimate signals matter (downy mildew, powdery mildew, botrytis)
Downy mildew (e.g., Plasmopara in vineyards, Peronospora in vegetables) is often linked to leaf wetness periods, humid nights, and mornings with dew/fog followed by favorable temperatures. In practice, long stretches of high RH and condensation are key indicators, especially in areas with weak airflow.
Powdery mildew (e.g., Erysiphe) can develop even without visibly wet leaves, but it is influenced by humidity, temperature, and stable microclimates inside the canopy. In greenhouses and tunnels, the swing from warm days to cool nights can create consistent microzones, and very low VPD (near-saturated air) increases risk in many situations.
Botrytis (grey mold) thrives in humid, condensing, stagnant air—especially when susceptible tissues are present: flowers, wounds, fruit near ripening, dense clusters. In flowers, strawberries, tomatoes, and grapes, managing condensation and ensuring fast drying of leaves and petals is critical. For all three, daily averages are not enough; the exact hours and the specific zones where moisture persists are what matter.
3) What to measure realistically: RH, temperature, VPD, plus operational indicators
The minimum viable dataset for a risk workflow is: relative humidity (RH) and air temperature in representative zones, from which you calculate VPD (vapor pressure deficit). VPD is often a more practical, stable indicator than RH alone because it ties humidity to temperature and tells you how strongly the air can dry plant surfaces.
Beyond these, GrowGuard lets you add parameters that indirectly influence risk: soil moisture (late irrigation can keep night air humid), EC and pH (nutritional stress can increase plant susceptibility), and battery/sensor status (missing data during critical windows leads to poor decisions).
Placement is part of “measuring.” One point in a long tunnel rarely represents everything. In orchards/vineyards, the difference between low-lying edges and higher ground can be substantial. In GrowGuard, the sensor map helps you define zones and instantly see where microclimate is drifting out of bounds.
4) Critical time windows: why night and early morning often decide everything
Many high-risk episodes are built overnight and in the first hours of the morning: temperature drops, RH rises, and if leaf surface temperature falls below dew point, condensation forms. Even without rain, dew can keep leaves wet long enough for spores to germinate.
A practical signal is the combination of: very high RH for several consecutive hours, temperature within favorable ranges, and low VPD (air close to saturation). Then you track how quickly conditions dry after sunrise or after opening vents. Slow drying means longer exposure.
In greenhouses, critical windows can be amplified by: early vent closure, insufficient air circulation, heating that is not coordinated with dehumidification, thermal screens that reduce air exchange, and evening irrigation. Outdoors, they can be amplified by high canopy density, weeds, row orientation, shaded zones, and local temperature inversions.
5) Thresholds and simple rules (without turning them into “universal recipes”)
It is tempting to look for one RH threshold or one VPD value that “tells” you disease will happen. In reality, thresholds depend on crop, growth stage, cultivar, canopy density, and management. Still, simple rules can be useful for prioritization—not for diagnosis.
Examples of operational rules: (1) if you have many consecutive hours of high RH and very low VPD overnight, schedule morning scouting in those zones; (2) if VPD stays low after sunrise and leaf drying is slow, adjust ventilation/heating/air movement; (3) if the forecast indicates another 2–3 similar humid nights, prepare preventive measures (including phytosanitary decisions) before the peak window.
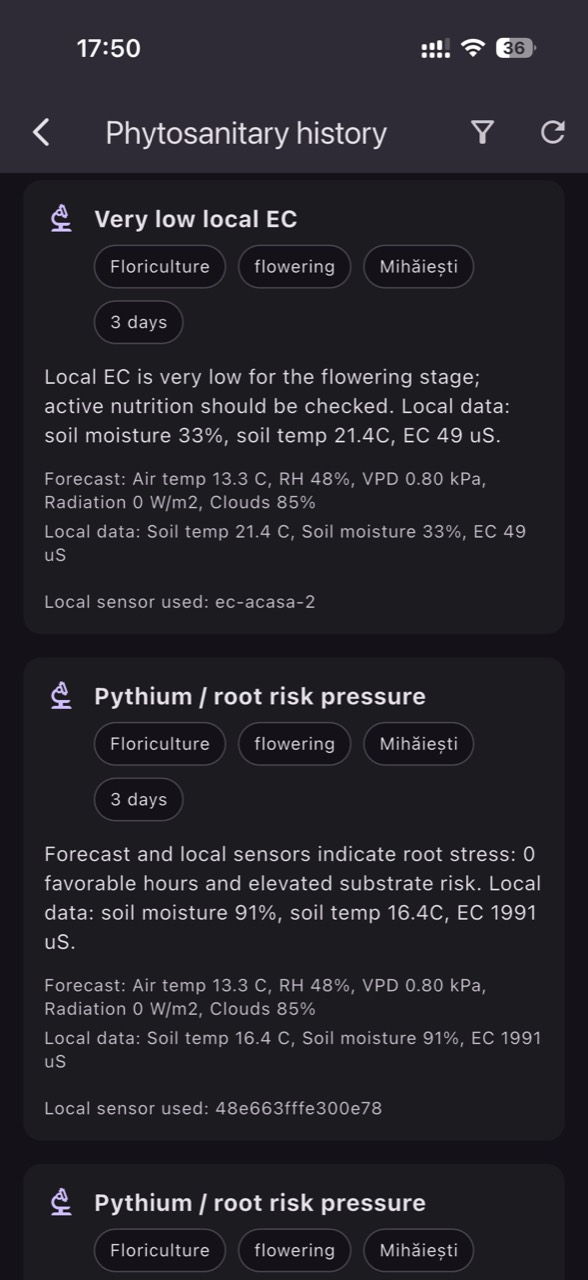
In GrowGuard, these rules can be implemented as AI-assisted phytosanitary alerts and configurable notifications by zone, so you get a signal when combinations of factors become relevant for downy mildew, powdery mildew, or botrytis risk. The goal is a triage system: where to go first and which action has priority.
6) A 7-step daily workflow: from data to action
Step 1: Check the sensor map and sensor status. In GrowGuard you see live values and battery/sensor health. If a key zone has missing data, fix that before making decisions based on assumptions.
Step 2: Review last night by hourly intervals. Do not stop at daily averages; look for periods of high RH and low VPD, especially between midnight and a few hours after sunrise. These windows are often the engine of risk.
Step 3: Compare zones. Instead of saying “the greenhouse is humid,” identify which compartment, which end, which height, or which row had the longest exposure. Zone alerts only make sense if zones are defined correctly in the platform and sensors are placed to represent them (e.g., near a cold wall, in the center, in dense areas).
6) A 7-step daily workflow: from data to action (continued)
Step 4: Add forecast context. Forecasts do not replace sensors, but they help you understand whether you’re entering a “run” of risky nights (fog, cooling, low wind) or a period of natural drying. In GrowGuard, having forecast next to measured data supports planning: when to intensify ventilation, when to avoid late irrigation, and when to schedule scouting staff.
Step 5: Trigger climate and operational actions. In greenhouses: ventilation, air circulation (fans), short heating pulses to lift VPD and dry leaf surfaces, screen management, shifting irrigation earlier. In orchards/vineyards: canopy aeration work, weed control, localized interventions in “cool/humid” spots.
Step 6: Targeted phytosanitary scouting. Do not search “everywhere.” Go where alerts indicate high exposure and check susceptible tissues: leaf undersides, inner canopy, inflorescences/clusters, areas where droplets persist. In GrowGuard you can share team access so operators see the same zones and the same critical windows, reducing confusion between shifts and locations.
6) A 7-step daily workflow: from data to action (final)
Step 7: Document and verify in history. After you adjust ventilation or take an intervention (including a preventive spray decision), review GrowGuard history to see whether exposure to high RH/low VPD decreased during the critical windows. This turns “we did something” into “we reduced risk duration in zone X.”
This step is also essential for distributors/integrators: reports and exports help you show customers how data correlates with decisions and operational outcomes—without promising guaranteed prevention. Over time, history helps you build farm-specific internal thresholds.
7) Zone-based alerts: how to configure them so they are useful, not noisy
Good alerts are specific, actionable, and tied to a clearly defined zone. If you get too many notifications or they are too general, you will ignore them. Start with 2–4 critical zones (e.g., tunnel end, near a cold door/wall, a dense compartment, a shaded orchard corner) and refine after the first weeks.
Configure alerts on combinations rather than a single parameter. For example: high RH + temperature in a favorable band + VPD below an operational threshold for a minimum number of hours. GrowGuard’s AI-assisted phytosanitary alerts can help aggregate these conditions into a signal closer to biological reality than a simple “RH > X%.”
Use different alerts for different roles: managers receive risk alerts (runs of humid nights), operators receive action alerts (open vents / check zone). Team access in GrowGuard reduces time lost to messaging and interpretation.
8) History checks: correlating with operations, sprays, growth stage, and weather events
History is where you truly learn your farm. When an outbreak happens, don’t stop at “it was humid.” Look back: how many nights in a row had low-VPD windows? When was the longest risk period? In which zones did it persist?
Then correlate with operations: Did you irrigate late? Keep screens closed too long? Have a fan failure? Did a cold front drop temperatures suddenly? Without history, these are impressions. With history, they become testable hypotheses.
GrowGuard provides reports and time-range visualizations, plus the ability to integrate data from existing networks and systems: LoRaWAN, NB-IoT, MQTT, TTN API imports. For distributors, this flexibility matters when connecting farms with different infrastructures and building one consistent risk picture across locations.
Conclusion
A downy mildew, powdery mildew, and botrytis risk monitoring system does not need to be complicated, but it must be consistent: measure RH and temperature, track VPD, identify critical night and morning windows, compare by zone, add forecast context, trigger climate actions and scouting, then verify in history whether exposure decreased.
GrowGuard supports this workflow with live monitoring, a sensor map, forecast, AI-assisted phytosanitary alerts, AI Plant ID to support symptom identification in the field, reports, team access, and flexible connectivity (LoRaWAN, NB-IoT, MQTT, TTN API). In addition, soil moisture, EC, pH, and battery/sensor status round out the operational picture.
The practical outcome is not a promise of guaranteed prevention, but a clearer way to reduce guesswork: you know when and where risk increased, what you did in response, and whether interventions shortened the humidity and condensation windows that fuel fungal diseases.