Poinsettia is the potted crop where “almost right” shows immediately: uneven bracts, leaf drop, compact plants next to stretched ones. In the greenhouse, those differences often start from three factors that amplify each other: the irrigation rhythm in the substrate, salt accumulation (EC), and microclimate expressed through VPD.
If you track only one variable, you typically make the wrong decision. A “wet” substrate can hide poor oxygenation and damaged roots; a “good” EC in the fertigation tank does not guarantee the pot hasn’t concentrated salts; and a VPD calculated from air conditions may look comfortable while the leaf is cooler or warmer and actual transpiration differs.
Below is a working protocol, not a fixed recipe: which sensors are worth it, where to place them, what to observe daily, what to verify independently (via drainage, substrate extractions, and root inspection), what practical decision to take, and how to confirm afterward that the intervention improved uniformity. The emphasis is zone control, because one greenhouse contains several real microclimates.
1) Why bracts become uneven: water, salts, and transpiration
Bracts color and develop uniformly when vegetative growth is stable before color initiation and when stress does not swing from day to day. In a pot, water swings create alternation between “starvation” and “drowning”: a deficit day slows growth and calcium transport, while an excess day reduces root-zone oxygen, disrupts uptake, and increases sensitivity to root diseases.
On top of that comes salt concentration in the substrate when evaporation and transpiration are high, but irrigation volume or drainage is low. High EC in the root zone changes osmotic potential: the plant “accesses” water with more difficulty even if the substrate looks wet. VPD (derived from air temperature and relative humidity) signals how strongly the air pulls water from the leaf; when VPD varies widely, consumption varies too, and irrigation management becomes reactive rather than predictive.
2) Start with a correct diagnosis of substrate irrigation
In poinsettia, small pots and a growing canopy mean the window between “too dry” and “too wet” is narrow. That’s why the first step is not changing fertilizer, but validating that water arrives uniformly and that the substrate runs a healthy wet–then more aerated cycle. Observe real distribution: pots at edges, under fans, near aisles, and in the middle of benches dry differently even with the same program.
Independent verification should include: periodic weighing of a few reference pots (simple, but highly informative), checking drainage (if present), and root inspections on representative plants. If substrate moisture sensors look “stable” but pots cycle from very light to very heavy, suspect sensor placement (too close to a dripper or too near the pot wall) or an application-uniformity issue. Practical decision: adjust how water is applied (duration/number of pulses), not only total volume, then confirm that pot-weight variation narrows.
3) EC and pH: clarify what you measure, where, and why it matters
EC and pH are not abstract “crop values”; they are properties of a measured medium obtained by a method: raw water, fertigation solution, drainage, or a substrate extract. Tank EC can be stable while pot EC rises if water evaporates quickly and there is not enough leaching. Likewise, water pH can be acceptable while alkalinity (buffering capacity) slowly pushes substrate pH upward; that is why water analysis remains complementary to on-site pH/EC monitoring, not replaced by it.
For practical control, separate two checks: (1) verify what you deliver at the outlet (EC/pH of the fertigation solution); (2) verify the root zone (via drainage or extraction) to learn what the plant actually “sees.” A typical failure: you decide to raise fertilization because leaves look pale, but substrate EC is already high and uptake is locked out. The correct decision starts from measuring in the substrate, then a cautious intervention (for example, improve irrigation uniformity and temporarily reduce concentration), and confirmation comes from EC trends in drainage/extract and return to even growth.
4) VPD as an indicator: how to use it without being misled
VPD calculated from air temperature and relative humidity is an estimate of evaporative demand, not a direct measurement of transpiration. In poinsettia, leaf temperature can diverge from air temperature near glazing, screens, heat sources, or air streams; two areas with the same “air VPD” can therefore behave differently. What to observe in practice: hours when VPD rises abruptly (for example, after screens open) and whether you see slight wilting or more sensitive shoot tips during those transitions.
Independent verification: correlate VPD with real pot consumption (weighing or a drop shown by the substrate moisture sensor) and with plant response within a few hours, not only next day. A useful decision is not “hold VPD to one number,” but manage transitions: avoid large jumps via smoother heating/ventilation sequences and schedule irrigation so the substrate does not enter deficit exactly during high atmospheric demand. Check the result by tracking reduced moisture-amplitude swings and fewer plants showing transient wilting.
5) Sensor selection and placement: the difference between useful data and noise
For this crop you need three measurement types that cannot substitute for each other: substrate moisture (volumetric or tension-based, depending on your system), EC/pH with dedicated probes (in solution and/or via drainage/extraction method), and microclimate (temperature + humidity to compute VPD). A temperature sensor cannot measure EC/pH; and EC, even measured correctly, does not identify individual nutrient concentrations. Choose sensors with clear units, stable data, and a measurement you can cross-check with simple on-bench methods.
Place sensors in representative pots: avoid the first row by an aisle if it does not represent the crop mass, avoid pots where water hits the sensor directly, and set depth in the active root zone rather than near the surface. For microclimate, mount at canopy top height, shielded from direct air jets and direct radiation. A frequent failure is the “perfect sensor”: one area always looks fine because the sensor sits in a wetter corner or a more ventilated spot. Decision: compare two points in the same zone for a few days; verify differences match reality (pots, drafts), not mounting bias.
6) Zone control: turning greenhouse variability into concrete actions
Poinsettia responds differently to the same program when zones have different light, different distance to screens, or different flow along drip lines. So the goal is not a “pretty chart,” but identifying zones that fall out of rhythm: they dry faster, accumulate more salts, or sit more often in high air humidity. It helps to define operational zones (benches/compartments) and follow trends rather than instantaneous numbers.
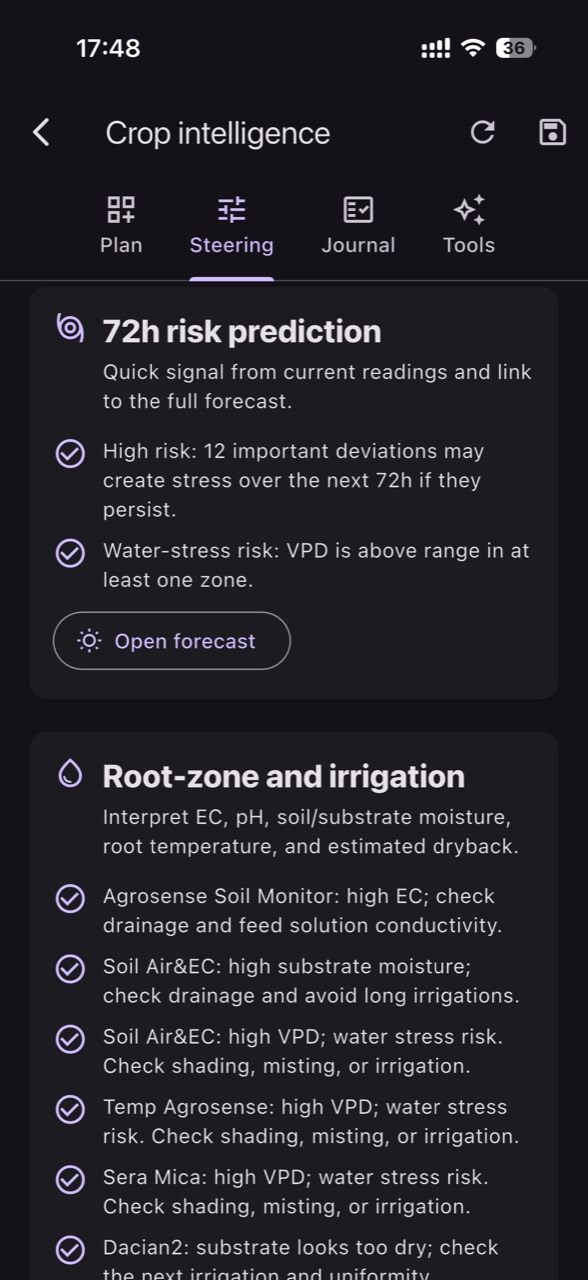
In GrowGuard, zoning and the sensor map help interpret data in placement context, and zone alerts can be set to flag persistent deviations rather than minute-to-minute noise. A hypothetical example: two zones receive the same irrigation, but one shows faster substrate drying every afternoon alongside higher VPD. Practical decision: adjust irrigation or microclimate management only for that zone (if infrastructure allows), or change local plant loading/shading. Verification: after 3–5 days, the zone gap narrows and bract development tracks more uniformly.
7) Alerts that actually reduce losses: thresholds, persistence, and field confirmation
Useful alerts are not the most numerous, but those that trigger a quick check and a repeatable decision. For poinsettia, build alerts around risks: water deficit (substrate drops too far versus its usual rhythm), water excess (substrate stays high too long), EC drift in the substrate (rising trend), solution pH outside your working band, and VPD episodes that coincide with visible stress. Add a persistence condition (lasting a minimum period) to avoid nuisance trips from short noise.
Independent confirmation is mandatory before changing the recipe: check a few pots by hand, measure EC/pH with a portable meter or from drainage, and look at roots if you suspect hypoxia. A common case: you receive a high-EC alert; a rushed decision is a “heavy flush” that cools the substrate and destabilizes plants. A robust decision: confirm EC is high in drainage/extract and check whether the substrate is already saturated; only then choose a gradual response. Verify via declining EC trend and return of a wet–aerated cycle without wilting.
8) The post-intervention verification loop: prove you fixed the cause, not the symptom
After any change (irrigation, microclimate, or solution composition), you need an “audit” window so you don’t confuse effect with normal crop variability. In the first 24–48 hours, track: change in substrate moisture amplitude, how quickly it returns to a stable level after irrigation, and whether VPD in the critical hours has softened. Over 3–7 days, check growth uniformity: new leaf expansion, turgor, row-to-row differences, and bract color consistency as plants enter the phase.
Independent verification at this stage includes small sampling: a few weighed pots per zone, an EC/pH measurement from drainage or extraction, and a root inspection on a representative plant (if you can sacrifice one). A hypothetical example: after lowering fertilizer concentration, substrate EC drops but plants remain uneven; then the cause may be microclimate (drafts, temperature) or water distribution rather than nutrition. Decision: adjust zone management (local airflow, bench allocation, flow check). Confirm success by convergence of zone trends and fewer “outlier” plants.
Conclusion
Bract uniformity in poinsettia does not come from one indicator, but from agreement between three loops: substrate water (rhythm and oxygenation), salts/pH measured in the correct medium (solution versus substrate), and microclimate expressed through VPD (especially transitions). When you link them, you reduce abrupt interventions and move toward small, verifiable decisions that stabilize the crop.
If you run compartments or benches with visible differences, zone alerts and microclimate comparisons help you react where needed rather than “across the whole greenhouse.” In GrowGuard you can track these indicators by zone and set alerts that require on-bench confirmation before major changes; if you want, start with 2–3 pilot zones and expand only once the data supports your decisions.