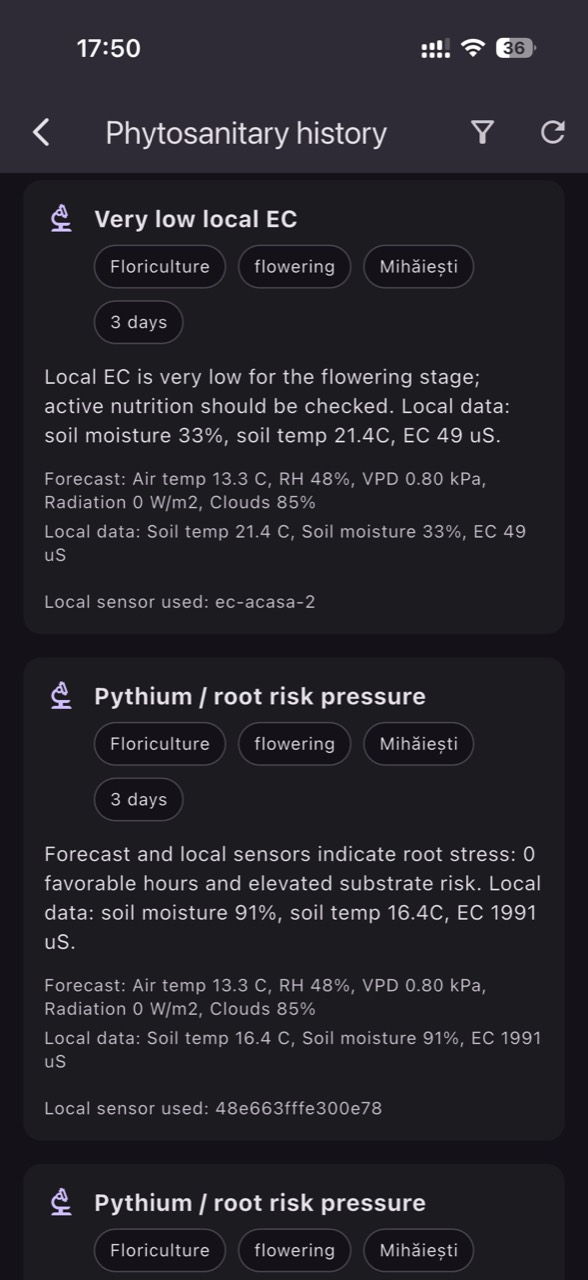
Seeing risk before symptoms means tracking the conditions that make disease possible, not the disease itself. In horticulture, many episodes begin from a repeated combination of humidity, temperature, and wet foliage, followed by a window for sporulation and infection. When symptoms become visible, the practical window to intervene is often already narrowed.
“Smart” phytosanitary alerts are only useful if they’re commissioned correctly: the right sensors, placed and interpreted in the same language as on-farm decisions. If data arrives too rarely, in wrong units, or from an unrepresentative point, an alert turns into noise. The goal is not more notifications, but fewer that you can verify.
This article lays out technical fundamentals and a usable workflow: what each sensor actually measures, how a time series becomes a “risk signal,” what must be checked independently in the crop, and how to close the loop (decision–control–learning). The examples are hypothetical and meant to show steps, not impose universal thresholds.
1) What “risk before symptoms” is—and why it matters technically
Symptoms are the outcome; risk is the condition. In practice, risk rises when you get persistent combinations of high relative humidity, favorable temperatures, and long periods of condensation on leaves—especially in zones with weak ventilation or strong day/night swings. The mechanism is straightforward: wet leaf surfaces enable spore germination, and the thin air layer next to the leaf can be more humid than the “average” air in a tunnel or greenhouse.
What to observe: repeated “wet nights” or hours when air is close to saturation, followed by cool mornings and condensation. What to verify independently: inspect representative points for wet leaves (especially inside the canopy), visible water films, and uneven airflow. Practical decision: adjust ventilation/heating to shorten leaf-wet duration, then check results by comparing the duration of critical periods in data history with scouting notes from the same dates.
2) Correct data starts with the right sensor: what it measures—and what it doesn’t
For phytosanitary risk, the base is an air temperature and relative humidity sensor (to estimate dew point and VPD), sometimes complemented by a leaf-wetness sensor or a condensation indicator. Important: VPD calculated from air temperature and RH is an estimate; leaf temperature can differ, especially under high radiation or cold drafts. A temperature sensor cannot measure EC or pH—those require dedicated probes.
What to observe: consistency of the time series (no impossible jumps, no long “flatlines”). What to verify independently: use a handheld thermo-hygrometer for spot checks, comparing in the same location and moment—not in another zone. Practical decision: if differences are systematic, fix placement (height, shielding, distance from drafts) before “tuning” thresholds. Check the result: after repositioning, the gap between sensor and reference should reduce and remain stable over time.
3) Data freshness and resolution: when an alert arrives too late
Risk before symptoms is about time. If data arrives at intervals that are too coarse, or with delays, you can miss the exact period when leaves were wet or when air reached saturation. For microclimate, dynamics matter: rapid transitions at sunrise, after irrigation, after vents close/open. During commissioning, decide which “events” you need to capture and confirm that the measurement frequency can actually describe them.
What to observe: lack of variation on a day when you know you ventilated, irrigated, or—under tunnels—had rain-driven humidity spikes, or values that arrive only in sparse “bundles.” What to verify independently: log the time of operations and compare to data timestamps; if they don’t align, you likely have latency or reporting-interval issues. Practical decision: optimize reporting interval and check connectivity. You’ll know it worked when operational events leave a clear “signature” in the graph.
4) Placement for phytosanitary risk: microclimate is not uniform
Most misleading alerts come from a single measurement point chosen for convenience rather than representativeness. In tunnels, risk is often higher at ends, near cold walls, in shaded strips, or where the canopy is dense. In orchards/vineyards, risk can rise in low spots, along shelterbelts, or on rows with poor air circulation. Mechanistically, the same general weather produces different crop-level microclimates.
What to observe: persistent differences between zones (for example, one area stays more humid at night). What to verify independently: walk the crop at key moments (pre-dawn, right after irrigation, after closing up) and look for condensation or leaves that dry slowly. Practical decision: define risk zones and place the sensor in the “worst controllable case,” not the “comfortable average.” Check the result when alerts consistently match what you see in that same zone.
5) From parameters to signal: building a verifiable alert rule
A good alert describes an agronomic condition, not an isolated number. Instead of “high humidity,” a useful signal might be “cumulative overnight duration near saturation” or “a sequence of hours with low VPD and stable temperature”—context that supports persistent condensation. Thresholds are not universal: they depend on crop traits (canopy density, susceptibility), system (soil vs. substrate), ventilation capacity, and your farm’s history of issues.
What to observe: how many alerts you get and whether they occur in logical windows (night/morning, after irrigations). What to verify independently: after an alert, look for early, non-specific signs (wet leaf zones, micro-condensation, leaves sticking together) without confusing that with disease diagnosis. Practical decision: adjust the rule with only one change at a time (duration, hysteresis, aggregation), then verify by tracking whether false alerts drop without “blinding” you to meaningful risk periods.
6) Connecting irrigation and nutrition: avoiding misinterpretations
Phytosanitary risk doesn’t come only from air; it also relates to how long the crop is kept in a “wet-friendly” state. Late or excessive irrigations can extend humidity within dense canopies, and stress can change susceptibility. But keep measurements distinct: EC and pH are measured in a specific medium—water, fertigation solution, substrate extract, or bulk soil—and those readings are not interchangeable. Each has different meaning for decisions.
What to observe: whether irrigation timing coincides with humidity spikes or VPD drops. What to verify independently: if you suspect salinity stress or imbalance, confirm using the appropriate method (for example, water/solution analysis or a substrate extraction), and do not infer individual nutrients from EC—EC does not identify each element’s concentration. Practical decision: shift irrigation timing or dry-back strategy, then check on comparable days whether risk-duration decreases while the crop maintains its growth rhythm.
7) A 10-step commissioning workflow: from installation to routine
Step 1: define target risks (condensation, long high-humidity periods, heat waves followed by cold nights). Step 2: choose sensors (T/RH; optional leaf wetness) and confirm units. Step 3: select zones. Step 4: install and record exact positions. Step 5: field-check with a portable reference. Step 6: confirm data freshness. Step 7: start alerting conservatively, using duration-based conditions rather than short peaks.
What to observe: in the first 7–14 days, focus only on correlation with field reality, not “perfect” thresholds. What to verify independently: scout after each relevant alert and record whether you found wet leaves/condensation and in which zone. Practical decision: adjust in sequence—first placement, then data frequency, then thresholds. Check the result with a simple log: alert–observation–intervention–effect visible in the next 24–48 hours of data. If you use GrowGuard, keep this log aligned with zone-based sensor history so the loop stays auditable.
8) Common failure cases—and how to spot them before you lose trust
Failure 1: sensor too close to artificial sources (heater, door, fan) that “manufacture” risk. Failure 2: poor shielding or direct wetting (drips, mist) that inflates humidity readings. Failure 3: “frozen” values or slow drift that moves thresholds without you noticing. Failure 4: mixing up risk with diagnosis: a risk alert does not detect a pathogen; it only indicates favorable conditions.
What to observe: alerts when the crop is clearly dry, or no alerts when you see condensation. What to verify independently: compare two points (a temporary sensor or mobile reference) and check whether differences are constant or occur only at certain times (pointing to placement/drafts). Practical decision: reposition and add a sanity check rule (for example, ignoring impossible values) before further tuning. Check the result when alerting becomes consistent with your morning walk-throughs and with the operational “signatures” in the data. GrowGuard can help by flagging sensor status issues, but the field check remains essential.
Conclusion
AI phytosanitary alerts work when you treat them as a measurement-and-decision system: choose the correct medium and units, ensure data is fresh, place sensors in critical microclimate zones, and build signals based on duration and context. Then verify independently in the crop and close the loop with interventions that leave measurable traces in the next day’s data.
If you use GrowGuard, you can commission these alerts by zone and validate them through sensor history plus a disciplined scouting log—while keeping a strict separation between risk and diagnosis. For a workflow adapted to your site (crop, protected space, or open field), start with a week of measurement without alerts and only build rules after you’ve confirmed what “risk” looks like on your ground. If you want help structuring that commissioning plan, start by setting up zones and a simple alert–check–adjust routine in GrowGuard.