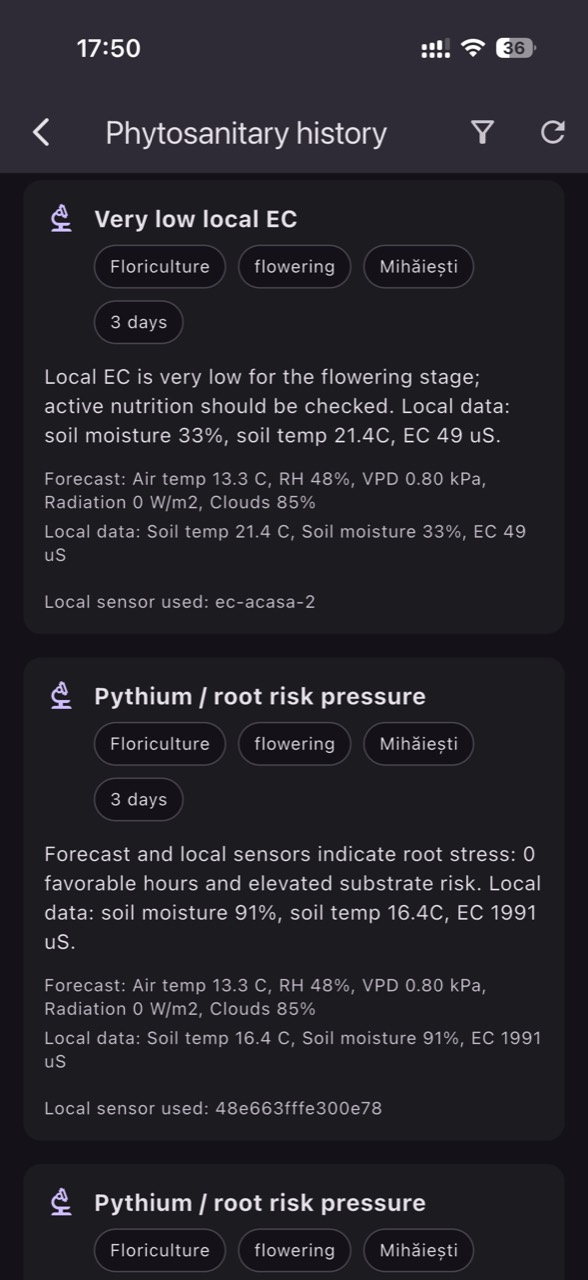
“Before-symptom” phytosanitary alerts do not mean you can see the pathogen. They mean you can capture the conditions that make infection possible. In many crops, the critical window can be only a few hours: leaves stay wet, air becomes saturated, and temperature supports spore germination. If you only react when spots appear, you have usually missed the best intervention timing.
To be useful, alerts must be built as a system: appropriate sensors, fresh data, correct units, zone-specific thresholds, and a field verification routine. A good alert sends you to inspect the right place at the right time with a clear hypothesis about cause. A poor alert creates noise—and eventually distrust.
This article covers the technical fundamentals and a commissioning workflow: how to choose measurements that indicate risk, how to confirm sensors are installed and interpreted correctly, how to set thresholds without universal settings, and how to validate whether an alert truly correlates with risk rather than installation or connectivity errors.
1) Why risk appears before symptoms: the biological mechanism in brief
In most fungal and bacterial diseases, the visible symptom is a late stage: infection has already occurred and plant tissue starts reacting. Risk, however, is driven by measurable physical factors: duration of leaf wetness, very high relative humidity, suitable temperature, day/night transitions, canopy density, and air movement. In protected cropping, microclimate can vary sharply between ends of a house, near doors, or under screens.
What to observe: morning condensation, leaves stuck together, denser canopy zones, and slow drying after irrigation. What to verify independently: inspect leaves in the alerted zone for a water film, spot-check with a handheld thermometer/hygrometer, and record time-of-day. Practical decision: adjust routine (ventilation, canopy management, irrigation timing). How to check results: track whether episodes of very humid air shorten and whether leaves dry faster after similar events.
2) Which measurements support early alerts—and what they cannot tell you
For phytosanitary risk, the foundation is microclimate: air temperature, relative humidity, and the derived VPD. VPD is an estimate calculated from air temperature and relative humidity; it is not the same as “how wet the leaf is,” and leaf temperature can differ from air temperature. If you have a leaf-wetness sensor, it describes water-film episodes more directly, but it has limitations in positioning and interpretation.
What to observe: multi-hour sequences of high humidity at night or after irrigation, followed by sharp changes at sunrise (condensation dynamics). What to verify independently: compare to visual evidence (condensation and drying) and to site logic (doors, drafts, shading). Practical decision: configure alerts around “duration” (consecutive hours) rather than a single instantaneous value. How to check results: confirm alerts coincide with times when leaves remain wet or air stagnates in the zone.
3) Sensor selection: microclimate versus root zone (and units)
Not every “phytosanitary problem” starts in the air. In frequently irrigated crops, the root zone can create background stress that increases susceptibility: excess water, poor oxygenation, large moisture swings, and elevated salinity. This is where soil/substrate moisture sensors and EC/pH probes matter—each requires its own dedicated probe. A temperature sensor does not measure EC or pH, and EC does not identify individual nutrient concentrations.
What to observe: uneven growth under similar air conditions, zones that dry slowly, irregular drainage, or marginal burn. What to verify independently: check irrigation performance (flow, uniformity) and, when appropriate, do a substrate extraction or water/fertigation analysis. Important: EC depends on medium and method (irrigation water, fertigation solution, substrate extract, bulk-soil measurement). Practical decision: separate microclimate alerts from root-zone alerts. How to check results: correlate alerts with drainage behavior, root appearance, and uniformity trends.
4) Designing “risk zones”: where to place sensors to capture the critical window
Good alerts start from a risk map, not a single average point. In protected spaces, problem zones are often: greenhouse ends, near doors, shaded corners, under thermal/shade screens, near windbreaks, or in rows with high canopy density. In open field, risk can increase in depressions (fog/dew), near shelterbelts, on heavier soils, or in blocks with uneven irrigation distribution.
What to observe: vigor differences, recurring spots “always in the same place,” and moments when one zone’s canopy is dry while another is still wet. What to verify independently: walk the crop at key hours (late night, sunrise, after irrigation) and note smell of damp air, visible condensation, and drafts. Practical decision: define 2–4 representative zones plus one “problem” zone, each with microclimate sensing and—where relevant—root-zone sensing. How to check results: compare zones; if differences never appear, sensors are too close or placed in overly similar locations.
5) Data commissioning: freshness, timing, drift, and “stuck values”
Before relying on alerts, confirm data is fresh and internally consistent. Phytosanitary risk is built on duration (consecutive hours), so sampling interval and data gaps matter. If a sensor reports too infrequently, you can miss the condensation window. If it reports with delays, the alert arrives after the window has passed. Typical failure modes also include low battery, signal loss, sensor drift, or values that freeze at the same number.
What to observe: impossible jumps, 100% relative humidity for days, identical inside/outside temperature patterns when they should differ, or missing data exactly when weather changed. What to verify independently: compare with a handheld instrument and a second measurement point in the same zone; confirm real events (opening vents) show up as real changes in the time series. Practical decision: do not activate operational alerts until you complete a one-week “data audit.” How to check results: after corrections, curves should respond to real events in a repeatable way.
6) Building the alert: from a simple threshold to a “risk window”
A single-threshold alert (for example, “RH above X”) often produces false alarms because it ignores duration, temperature, and time-of-day dynamics. A more robust approach is the “risk window”: a combination of conditions maintained long enough to matter. In practice, start with simple rules and refine them: different day/night logic, consecutive-condition requirements, excluding periods of strong ventilation, or using forecast as context rather than absolute truth.
What to observe: repeated alerts without any field issue (noise) or, conversely, symptoms appearing without prior alerts (blind spots). What to verify independently: at each alert, record whether leaves were actually wet versus only humid; check whether the alert coincides with operations that raise humidity (irrigation pulses, misting, wash-down). Practical decision: tune alerts by duration and by zone, not globally. How to check results: alerts should consistently point to the same weak zones rather than firing randomly across the site.
7) Reaction workflow: what to do when an alert arrives so it’s not just a notification
A risk alert is a trigger for scouting and environment control, not a diagnosis. A useful protocol has clear steps: (1) quick data confirmation (not a sensor error), (2) in-zone visual check (condensation, leaf-to-leaf contact, canopy density), (3) operational check (vents, screens, irrigation schedule), (4) corrective decision. In greenhouses, typical decisions focus on reducing leaf-wetness duration without creating heat or water stress.
What to observe: after an intervention, microclimate can change fast while the plant responds slowly—so you need intermediate criteria. What to verify independently: 30–60 minutes after adjustment, spot-check whether humidity drops and VPD shifts in the intended direction; confirm you did not create cold drafts that cause localized condensation. Practical decision: keep a simple “alert–action–effect” log for 2–3 days. How to check results: similar nights should show shorter high-humidity episodes in the affected zone.
8) Validation over time: correlation, cross-checks, and model limitations
Validation means showing alerts correlate with risk, not coincidence. Use three controls: compare zones (alert zone versus a “reference” zone), compare time periods (nights with similar outside conditions), and compare to independent observations (dew/condensation, historically high-pressure areas). Also account for crop stage: the same humidity can have a different impact at seedling stage versus a dense vegetative canopy or later fruiting when the canopy closes.
What to observe: if alerts increase during dense canopy periods and drop after defoliation or improved ventilation, that suggests sensitivity to the real mechanism. What to verify independently: if symptoms appear, document them and note whether alerts preceded them; if symptoms do not appear, do not conclude “disease prevented”—only that risk was managed or that pressure did not materialize. Practical decision: adjust thresholds and rules seasonally rather than leaving them “set once.” How to check results: irrelevant alerts decrease while the share of alerts that lead to real field observations increases.
Conclusion
Smart phytosanitary alerts are, fundamentally, a risk-window management system: measure the conditions that precede infection, verify in-field that those conditions truly exist, make an operational decision, and confirm the effect using data plus observation. The difference between “notifications” and a protocol is commissioning discipline—and a clear separation between air-driven risk and root-zone-driven stress.
If you use GrowGuard or a similar platform, treat alert configuration as a commissioning project: define zones, run a data audit, build duration-based rules, and keep an alert–action–effect log. For a faster start with a correct structure, you can request a short setup and validation session tailored to your crop using data from the first weeks.