In apple orchards, late frost is not a “uniform” event. It is a sequence of critical minutes in which a low-lying block can drop below a damaging threshold while a slope block remains above it. The difference comes from cold-air drainage, soil cover, and nighttime calm. That is why monitoring must be designed around microclimates, not a single station.
Leaf wetness complicates the picture: leaves can be wet without rainfall, from dew or fog, and the duration of wetness sets risk windows for foliar diseases, including apple scab. If alerts rely only on relative humidity, you can overestimate or underestimate the true wetness period in the canopy. Leaves inside the row also dry differently than those on the edge.
A useful protocol starts from mechanisms (how frost forms, how dew deposits), continues with sensor choice and placement, then moves to comparisons between blocks and to using the forecast as an “early warning.” Finally, every alert must lead to a concrete decision and a post-event check: did frost occur where we thought, did wetness persist as long as estimated, and what should be adjusted next time?
1) What kind of frost is it: radiation vs advection, and why it matters
Radiation frost typically occurs on clear nights with light wind: the ground loses heat by radiation, the air near the surface cools, and colder air “flows” into low areas. A temperature inversion can form, so air at 2–3 meters may be warmer than air at 0.5–1 meter. Advective frost arrives with a cold air mass and wind; microclimate differences may shrink, but exposed zones can cool faster and suffer more tissue dehydration.
What to observe: temperature evolution by height, wind behavior (even a local estimate), and how fast temperature drops after sunset. What to verify independently: a handheld thermometer check at 0.5–1 m in the suspect low spot, plus field observation (frost crystals, fog pooling in the valley). Practical decision: define two alert logics—one for clear/calm nights (focus on local minima), another for cold fronts (focus on trend and wind exposure). Result check: compare recorded minima with visible frost patterns and any bud symptoms that appear in the following days.
2) Where to measure frost temperature: height, shielding, and “trap” zones
In apple, the sensitive organs are in the canopy, but on inversion nights the coldest layer may sit close to the ground. That is why a single sensor “by the yard” or at 2 m can miss the critical moment in a low orchard block. Choose air-temperature sensors mounted with radiation shielding, and place them in a representative spot within the block: between rows, not tight to the trunk, and not over unusually wet soil or heat-retaining surfaces.
What to observe: the difference between a low pocket (cold-air accumulation) and a well-ventilated area during the same night. What to verify independently: a punctual manual reading at the lowest point before the nightly minimum to confirm the sensor is not biased by an obstacle or an artificial micro-pocket. Practical decision: if you use frost protection (for example, via a separate automation project), triggering should be conditioned by the coldest zone, not the farm average. Result check: after the night, compare zone temperature curves; stable differences support the placement, while chaotic swings suggest shading, poor shielding, or proximity to heat sources.
3) Orchard microclimate: topography, soil, grass, and building “comparable zones”
Microclimate is not only elevation. Wet soil stores and releases heat differently than dry soil; tall grass can reduce daytime warming of near-ground air and intensify nighttime cooling. Windbreaks, hedgerows, and buildings can block cold-air drainage, creating “lakes” of cold. In apple, these effects become critical at sensitive phenological stages, where small temperature differences can become large differences in damage.
What to observe: repeatable patterns—one block repeatedly runs colder, or stays wetter in the morning. What to verify independently: a simple map of low points, barriers, and likely cold-air drainage direction; confirm it on the ground over 2–3 representative nights. Practical decision: define monitoring zones that are truly comparable (for example, “valley vs slope,” “near windbreak vs open”), rather than a random mix of sensor points. Result check: if zone differences remain stable over time, you can calibrate alerts per zone; if not, you likely have a placement problem or a microclimate that shifts enough to require additional points.
4) Leaf wetness: why “high RH” does not automatically mean wet leaves
Leaves become wet when water vapor condenses or when deposition occurs directly (dew, fog, rain, irrigation splash). High relative humidity raises the probability of condensation but does not guarantee it: leaf temperature can fall below air temperature due to radiative cooling, and airflow inside the canopy is weaker, prolonging drying. Also, wetness can persist locally after rain while a sensor in a ventilated spot “sees” rapid drying.
What to observe: the actual duration of leaf wetness overnight and during calm mornings. What to verify independently: a sunrise visual inspection in 2–3 locations (row edge, row interior, low pocket), noting whether leaves are wet—not just that “the air feels humid.” Practical decision: use a leaf-wetness sensor in zones with historical pressure, and define the alert on duration (how many consecutive hours of wetness) and context (temperature supportive of disease development), not on a single peak. Result check: after an event, compare “wet-leaf hours” in data with field observations; if they do not match, adjust placement (angle, exposure, position relative to a representative canopy).
5) Sensor selection and commissioning: what can fail, and how to catch it early
For frost and leaf wetness you minimally need air temperature (and ideally relative humidity) plus a leaf-wetness sensor at key points. At commissioning, the common problem is not “laboratory accuracy” but installation realities: a temperature sensor without shielding can overheat during the day and distort interpretation of the nighttime trend; a leaf-wetness sensor mounted too close to branches may be splashed unevenly or artificially sheltered from wind.
What to observe: suspicious signals—sudden jumps, identical values between zones that should differ, or “wet leaf” readings at midday in sun and wind. What to verify independently: a basic coherence test between nearby sensors (two close points should follow the same trend with small differences), plus a physical mounting check after rainfall. Practical decision: set alert thresholds only after 7–14 days of data and after confirming sensors respond realistically to events (rain, dew, daytime warming). Result check: keep an event journal (hypothetical examples: clear night, fog in valley, brief shower) alongside the graphs; if graphs do not reflect the journal, do not force thresholds—fix the cause.
6) Useful alerts mean zone comparisons, not only absolute thresholds
In commercial orchards with different blocks, a single farm-wide alert quickly becomes noise: it either triggers too often or misses local situations. A more robust approach is alerting on differences between zones and on trends. For example, a low block that consistently runs a few degrees colder than a reference block warns you that the microclimate is “pulling down” before an absolute threshold is reached elsewhere.
What to observe: the gap between the “cold zone” and the “reference zone,” and the cooling rate in each block. What to verify independently: confirm zones are comparable in installation (same height, same shielding), so you do not mistake mounting differences for microclimate differences. Practical decision: configure zone alerts with two conditions: (1) temperature below a locally chosen threshold that fits your phenological stage, and (2) a difference versus the reference zone or a rapid cooling slope. Result check: after the night, evaluate whether the early alert provided actionable lead time; if it was too early and useless, adjust the trend condition rather than “muting” the entire system. If you use GrowGuard, a zone map can help you quickly see where the pattern repeats and where it is an exception.
7) Forecast in context: how to use it without replacing sensors
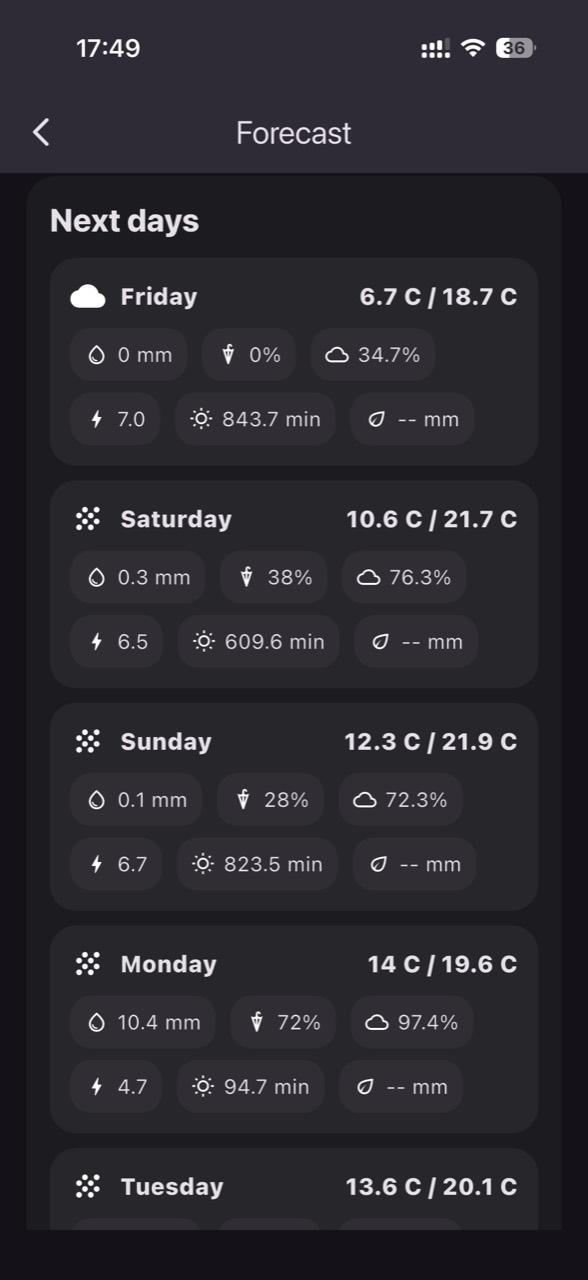
A forecast is a planning tool, not a measurement in your block. In radiation frost, the difference between “0°C forecast” and “-2°C in the valley” can be driven by clear sky, calm wind, wet soil, and terrain. Still, a forecast can provide the preparation signal: risk windows, frontal passages, likelihood of fog, or wind shifts. Used correctly, forecast triggers checks and readiness—not blind decisions.
What to observe: agreement between forecast minimum and the real trend measured in the first hours of night. What to verify independently: before midnight, compare temperature and humidity in the cold zone to the forecast scenario; if you are already below the forecast trajectory, treat the night as “high risk” regardless of the displayed minimum. Practical decision: set a “pre-alarm” based on forecast (a hypothetical example: risk of dropping below your chosen threshold in the next 12 hours) and an action alert based on real-time sensors. Result check: after the event, note whether the forecast overestimated wind or missed clear skies; this calibrates expectations for your region without discarding forecast value. In GrowGuard, forecast can be kept as a context layer next to real history precisely for this comparison.
8) From alert to action: frost, leaf wetness, and post-event verification
Alerts only matter if they lead to clear, verifiable actions. For frost, the action may be logistical (team readiness, quick verification in low zones, protection decisions according to the farm’s technology). For leaf wetness, the action is usually phytosanitary planning: scheduling inspections and intervention windows, without confusing “risk” with “diagnosis.” A leaf-wetness alert does not detect a pathogen; it only shows that the environment was favorable for a time interval.
What to observe: after a wet episode, warming combined with sustained humidity can extend a risk window even if it stops raining. What to verify independently: an orchard inspection (especially in zones where wetness lasted longer) and a check of leaf coverage/drying in different canopy positions. Practical decision: prioritize blocks with longer leaf-wetness duration and more favorable temperatures rather than treating everything uniformly. Result check: after 48–72 hours, evaluate whether your response matched the risk (more signs in “wetter” zones, fewer in ventilated zones); if the difference never appears, reassess the leaf-wetness sensor or the way zones were defined. In a GrowGuard workflow, the same field observations can be shared with the team so alerts consistently lead to on-site checks, not assumptions.
Conclusion
Frost and leaf-wetness monitoring in apple orchards becomes truly useful when it is built around microclimates and verified in the field. Mechanism (inversion, cold-air drainage, condensation), observation (trends, durations), independent verification (spot measurements, sunrise inspections), decision (zone-based prioritization), and post-event control (what actually happened) should form a loop, not isolated steps.
If alerts feel exhausting or “do not match reality,” most often the issue is not the threshold but sensor placement, zone comparability, or the absence of an event journal. Keep the system simple but verifiable, and change settings only after confirming sensors measure their own environment correctly. If you want to turn zone comparisons into easier-to-follow alerts and shared records, GrowGuard can be used as a monitoring and team-coordination platform.