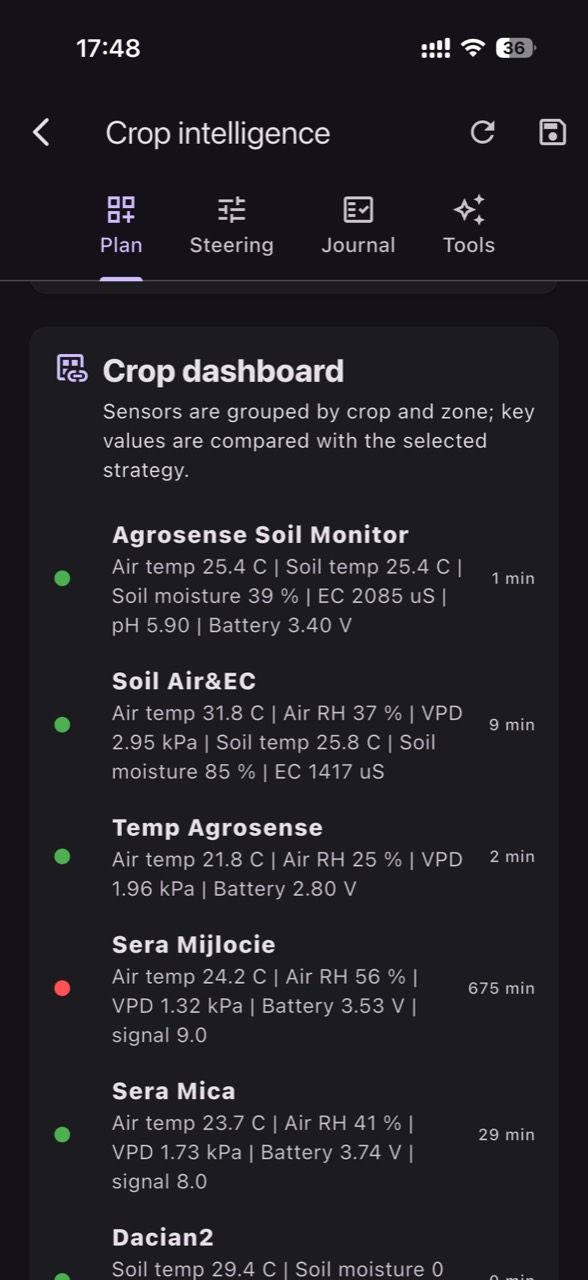
In commercial aronia plantations, the problem is rarely “how much water the farm has,” but how uniformly that water reaches the active root zone. Mulched rows, drip irrigation, and soil texture differences create areas that dry out first and areas that stay too wet. Water stress often starts locally, before it becomes visible across the whole block.
Aronia has a root system that is sensitive to poor aeration: a soil that stays too wet reduces oxygen availability, slows growth, and can increase humidity-associated disease pressure. At the other extreme, short deficit episodes during hot periods can reduce shoot growth and the uniformity of berry sizing. That is why monitoring must capture dynamics (drying and rewetting), not just an “average” number.
A useful workflow starts from plant physiology and irrigation hydraulics: what happens in the wetted bulb, how quickly moisture recovers after an irrigation event, how deep the water moves, and where stagnation occurs. Below is a practical protocol for sensor choice, placement, commissioning, and decision verification, with explicitly hypothetical examples.
1) What water stress means in aronia—and why “alternation” is riskier
The key mechanism is a repeated mismatch between water uptake and the roots’ ability to function in a well-aerated soil. When the soil dries quickly, stomata partially close, photosynthesis drops, and the plant shifts toward survival rather than steady growth and uniform fruit filling. When you return abruptly with large irrigations, some water can move below the active root zone or create short hypoxic periods around roots if the soil pores fill too long.
What to observe: zones with different vigor along rows, a “dusty” or slightly wilted look during hot afternoons, shoots that stop elongating, large variation in berry size, or bushes that remain behind. What to verify independently: a small inspection pit near an emitter to see the wetted bulb’s depth/width and whether the soil is sticky and low-oxygen. Practical decision: adjust duration and frequency, not only total volume. Result check: in the next few days, look for reduced amplitude between the pre-irrigation minimum and post-irrigation maximum in the moisture curve.
2) Parameters worth measuring: what each tells you—and what it doesn’t
In the soil, priority goes to a moisture sensor (ideally one that clearly shows trends and irrigation response) and soil temperature, which affects root activity and evaporation rate. In the air, temperature and relative humidity help you understand atmospheric demand; from them you can estimate VPD, but treat it as an estimate because leaf temperature may differ from air temperature. A leaf-wetness sensor is most useful to connect humidity conditions with the risk of prolonged wet-leaf periods.
Interpretation traps: a temperature sensor does not measure EC or pH—those require dedicated probes—and you must state the measurement medium (irrigation water, fertigation solution, soil extract, substrate extract, etc.) when comparing EC. EC indicates total soluble salts; it does not identify individual nutrients. What to verify independently: when salinity or alkalinity is suspected, separate “on-farm monitoring” from “lab analysis”; on-site pH/EC checks complement laboratory water analysis, they do not replace it. Practical decision: use pH/EC as a drift signal that triggers targeted verification (water, solution, soil). Result check: confirm by repeating the measurement in the same medium and, when warranted, sending a sample for analysis.
3) Choosing soil sensors for aronia: depths, units, and decision compatibility
In drip-irrigated plantations, you must see how the root-zone fills and empties. A single measurement point can mislead if it doesn’t capture both “the rise” after irrigation and “the drawdown” between events. That is why it can help to install sensors at two depths (for example, one shallower and one deeper) or use a multi-depth profile sensor, depending on your chosen solution. Avoid imposing a “standard” depth; set it based on where active roots are and how the wetted bulb forms under your emitters.
During commissioning, clarify units (for example, volumetric water content or a sensor-specific index) and decide whether you will manage by absolute thresholds or by change rates. In aronia, changes are often more actionable: how much the value drops between irrigations and how completely it rebounds after irrigating. What to verify independently: do an operational correlation with a soil sample (feel method plus profile observation) at three moments—before irrigation, 1–2 hours after, and the next day. Practical decision: choose a sensor type that responds visibly to irrigation events. Result check: if graphs do not show step-ups after irrigation, either water is not reaching that point, or the sensor is poorly placed or installed.
4) Zoning the plantation: where to place sensors to catch the first stress signals
In aronia, “the block average” can create false confidence. The areas that enter stress first—sandier patches, wind-exposed strips, row ends, pressure differences along drip lines—often dictate uniformity and fruit quality. A practical protocol is to select at least three contrasting zones: one good-vigor zone, one weak-vigor zone, and one area suspected of stagnation or rapid water loss. In each zone, place the sensor at a relevant distance from the drip line and next to a representative plant, not near gaps or unusual edges.
What to observe: if the “weak” zone shows sharp drops and slow recovery, while the “stagnant” zone shows persistently high values with little oscillation, you have a risk map—deficit versus excess. What to verify independently: quick checks at emitters (flow, clogging, pressure) and a drainage check after an irrigation or rainfall event. Practical decision: manage by sectors (timing, duration, distribution checks), not “more water everywhere.” Result check: after corrections, watch whether zone trends start to converge; if one zone remains abnormal, the cause is likely physical (soil, drainage, irrigation hardware) rather than scheduling.
5) Commissioning: steps that turn sensors into credible data
Commissioning starts with three questions: are data arriving on time, are values plausible, and do they react to events? Check data freshness (reporting interval and delays) and record real irrigation/rain moments so you can confirm that sensors “feel” those events. Then validate plausibility: soil temperature consistent with the season, soil moisture that does not stay perfectly flat for days. A constant value can indicate a failed sensor, damaged cable, or placement outside the wetted zone.
Reaction test: plan a short, controlled irrigation (a hypothetical example), and observe whether the shallow sensor rises first and the deeper sensor rises later. If only the deep reading jumps quickly, you may have preferential flow paths (cracks, texture channels) or installation too close to an emitter. What to verify independently: open a small soil profile 30–60 minutes after irrigation to see the wetting front. Practical decision: if response does not match field reality, reposition before setting alerts. Result check: repeat the test after repositioning and keep notes as a seasonal reference.
6) Interpretation in context: linking soil to atmospheric demand without templates
Water stress is not decided from soil alone or air alone. On high-demand days (hot, dry, windy), the same soil moisture can lead to stress faster than on a mild day. So you correlate the moisture trend with air temperature/humidity and the forecast: if 2–3 very hot days are coming, today’s accelerated drawdown becomes a risk signal. VPD computed from air conditions is useful as an indicator, but it is not a direct measurement of the leaf surface.
What to observe: steeper daily moisture declines in the same zones—especially in the afternoon—and incomplete recovery after an evening irrigation. What to verify independently: visit the “control” zone (the one that stresses first) at peak hours and check leaf turgor plus soil temperature under mulch versus between rows. Practical decision: adjust irrigation timing (for example, splitting events ahead of demand peaks), not only increasing runtime. Result check: over the next 48 hours, look for a smoother curve and fewer temporary symptoms at critical hours. If symptoms persist, investigate roots and drainage—not just the schedule.
7) Detecting excess water and stagnation: signals, confirmations, and corrections
Excess water in aronia is often quieter than drought: the plant may look green, but growth slows, and disease pressure can rise when the microclimate stays humid. In data, excess shows as a high and persistent moisture level with few oscillations between irrigations, especially at depths where drainage should be visible. If after a modest irrigation the moisture remains high for a long time and soil temperature drops, root aeration risk increases.
What to verify independently: after irrigation or rainfall, check smell and structure in a soil profile for anaerobic signs, and observe whether water accumulates in depressions or whether mulch reduces evaporation in specific spots. Practical decision: shorten irrigations, increase the interval between events, or split into shorter pulses, while also checking drainage/leveling constraints. Result check: the next day, the sensor should show a natural decline; if it stays flat and high, it may not be “well-watered soil” but stagnation—or a poorly chosen measurement point.
8) Alerts and operational routine: avoiding false alarms and measuring decision results
Alerts only work when they start from a baseline of 1–2 weeks of correct, field-validated data. Instead of universal thresholds, build zone thresholds: what “too dry” means in the first-to-stress zone and what “too wet” means in the stagnation zone. In GrowGuard you can set alerts for soil moisture, temperature, air humidity, estimated VPD, and sensor status; the important part is defining the action each alert triggers (check, irrigation adjustment, irrigation-system inspection), not just receiving notifications.
What to verify independently: for each meaningful alert, do a standardized quick check (same plant, same point, similar time of day) and record the intervention. A hypothetical example: a “rapid drop” alert in the weak zone prompts an emitter inspection; you find a clogged segment, fix it, then watch whether the next irrigation produces a visible step-up and the recovery aligns with the good-vigor zone. Practical decision: link alert–action–verification in a short loop. Result check: at week’s end, compare zone trends; if alerts are frequent but never confirmed, adjust thresholds or re-check installation and data freshness.
Conclusion
Monitoring water stress in aronia becomes truly useful when you measure root-zone dynamics and relate them to atmospheric demand and the realities of drip distribution. The key is zoning: sensors placed in “critical” points reveal early both deficit and excess, and decisions are validated through simple soil-profile checks and by how the moisture curves respond after interventions.
If you want to turn these measurements into a clear team routine (monitoring, alerts, history, and zone comparisons), GrowGuard can serve as the visualization and alerting platform—while you keep the independent field checks that confirm each decision.