In blackberry plantations, mulched rows and drip irrigation create a paradox: water is delivered precisely next to the plant, yet the real distribution can be uneven, and the soil may stay too wet under mulch or too dry between cycles. Roots need oxygen as much as water, and stress often shows late—first in fruit size and uniformity, then in vigor.
At the same time, blackberry disease risk is tightly linked to microclimate. Dense canopy, high humidity and extended wet-leaf periods increase the chance that foliar problems and fruit issues will escalate. Important: “favorable conditions” do not mean a pathogen is present; they only indicate when it is worth intensifying scouting and tightening hygiene and canopy management.
This article explains the technical fundamentals and a usable commissioning workflow for monitoring soil moisture and disease risk with connected sensors viewed in GrowGuard. The focus is on choosing correct measurement points, running independent checks (spade profile, inspections, irrigation uniformity checks), making practical decisions, and validating that the decision produced the intended effect.
1) Why blackberries are sensitive to dry–wet swings and how it shows in production
Blackberries have periods when water demand rises abruptly—during flowering, fruit fill, and heat waves. When the root zone repeatedly swings from deficit to excess, plants take a double hit: deficit reduces growth and berry sizing, while excess reduces oxygen in the root zone, increasing stress and potentially favoring root decline. In mulched rows, evaporation is lower, which can mask slow drainage, compaction, and “staying wet” conditions.
What to observe: vigor differences along the row, midday wilting, small or uneven berries, and spots where water lingers after irrigation. What to verify independently: dig 2–3 spade checks (moisture feel, anaerobic smell, structure), plus a simple drip uniformity check (flow and runtime by sector). Practical decision: adjust duration and frequency based on soil response, not the “overall look.” Result check: sensor trends show gradual recovery and the same zones stop being the first to enter stress.
2) Choosing sensors: what you measure in soil vs air (and what a sensor cannot measure)
For soil moisture you need dedicated moisture sensors (commonly volumetric), ideally with soil temperature measured in the same zone. Soil moisture shows availability and irrigation dynamics; soil temperature helps interpret consumption and stagnation risk (a cool, wet soil dries slowly). For disease risk, air temperature and humidity are useful, and a leaf-wetness sensor placed near the canopy helps describe how long leaves remain wet.
Keep variables separate: a temperature sensor does not measure EC or pH; those require specific probes. In blackberries, EC/pH are most relevant when fertigating and you want to detect whether the solution and root zone are accumulating salts. But EC in irrigation water, fertigation solution, and soil/substrate are different measurement media/methods and are not directly comparable. Practical decision: start with soil moisture plus microclimate (air T/RH) plus leaf wetness in key zones; add EC/pH only when you have a clear protocol for where and how EC/pH are measured. Result check: readings look seasonally plausible and respond to events (irrigation, rainfall, ventilation).
3) Zone-based placement: the “first-to-stress” points are the most informative
In plantations with variable vigor, one “central” sensor can mislead decisions. In blackberries, differences often appear at row ends (different pressure along drip lines), where soil texture changes, in shaded areas, and in micro-depressions where water accumulates. A robust approach is to define at least three zones: a good-vigor reference, a weak-vigor zone, and a zone prone to stagnation—or, conversely, fast dry-down.
What to observe before installation: historical ponding, mold on mulch, differences in berry ripening timing, and weed patterns suggesting excess moisture. What to verify independently: a spade profile to see where moisture persists in depth, and a pressure/flow check by irrigation sector. Practical decision: install sensors in “extremes,” not in the average area. Result check: after several irrigations, the wetting/drying dynamics differ between zones and show you where intervention is needed first.
4) Depth and position near drip: avoiding misleading readings under mulch
In blackberries, active roots often concentrate in the upper layer, especially with mulch and frequent drip cycles. If a sensor is too close to the dripper, you may see sharp “spikes” that represent the immediate wet bulb rather than the broader root-explored volume; too far away and you may miss the irrigation effect altogether. The goal is to place the sensor in the effective root zone at a distance that captures the wetting front, not the immediate drip point.
What to observe in the first days: if moisture rises abruptly after irrigation and then collapses quickly, the sensor may be too close to the water source or have imperfect soil contact. What to verify independently: open a small window in the mulch and watch infiltration (in a hypothetical example, check after 30–60 minutes whether the wetting front reached the sensor depth). Practical decision: adjust placement before you “bury conclusions” into alert thresholds. Result check: the moisture curve becomes repeatable across irrigation cycles and correlates better with plant condition.
5) Commissioning checks: units, data freshness, and common failure cases
Commissioning is more than “a value appears.” Confirm units (for example, true volumetric water content vs a proprietary index), reporting interval, and data freshness: a stale value can look “fine” while hiding a real problem. In GrowGuard, monitor whether the sensor reports consistently and whether there are gaps or “frozen” values that suggest power, soil contact, or connectivity issues rather than a field condition.
Common failures include: poor soil contact (air gap), a tensioned cable that shifts during field work, placement in a preferential flow path (a crack or channel) that overestimates moisture, or a leaf-wetness sensor mounted too exposed to direct rain so it no longer represents canopy wetness. Practical decision: before setting alerts, run a 7–10 day baseline under normal irrigation and manually note events (irrigation/rain). Result check: graphs respond logically to events and differentiate zones without obvious anomalies.
6) Interpreting soil moisture for decisions: trends, not “universal settings”
In blackberries, strong decisions come from trends: how fast the root zone depletes between irrigations, how deep water penetrates, and whether the soil remains persistently too wet. Avoid universal “targets.” Soil texture, mulch thickness, plantation age, and canopy density can completely change dynamics. A useful sign is repeatability: when a typical irrigation produces a similar rise and then a predictable decline, the system is controllable and adjustments become meaningful.
What to observe: differences between cool and hot days, the effect of rain on top of mulch, and how the weak zone behaves compared with the vigorous reference. What to verify independently: hand-check moisture in the root zone (not only the surface) and correlate with plant condition in the morning versus afternoon. Practical decision: change frequency to reduce extremes (more often, while protecting aeration) or change duration to reach a useful depth without creating long wet plateaus. Result check: the weak zone stops “dropping first,” and the stagnation-prone zone stops staying on a wet plateau for days.
7) Disease risk mechanics: wet leaf, humidity, and canopy density
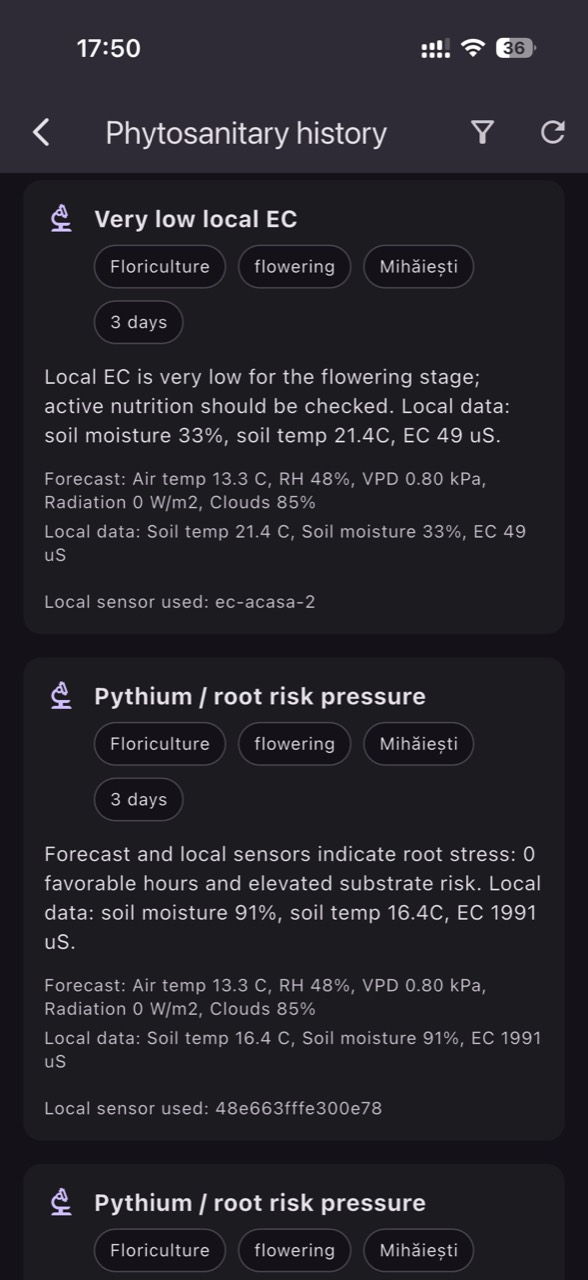
Many foliar and fruit problems intensify when leaves stay wet for long periods, especially when combined with favorable temperatures and a dense canopy that dries slowly. A leaf-wetness sensor, together with air temperature and humidity, describes the “window” when conditions are conducive. Remember the limitation: these readings indicate risk conditions, not pathogen presence, and they do not confirm a diagnosis—microclimate can be conducive even when inoculum is absent or controlled by hygiene.
What to observe: repeated nighttime wet-leaf episodes, humidity spikes after irrigation (especially if irrigating late), and differences between zones (for instance near windbreaks or shaded stretches). What to verify independently: targeted scouting 24–48 hours after a risk episode, hygiene checks (plant debris, dropped fruit), and a quick evaluation of row ventilation (density and training). Practical decision: adjust irrigation timing to avoid extending canopy wetness and prioritize canopy work that improves airflow. Result check: wet-leaf episodes shorten, and field scouting finds fewer early symptoms recurring in the same zones.
8) An operational team workflow: zone alerts, field confirmation, and post-event audit
A workable workflow relies on roles and confirmations, not alerts alone. Set zone-specific alerts in GrowGuard for: rapid moisture drops (stress), long wet plateaus (possible excess), extended leaf wetness (risk), and sensor status (battery/reporting). Thresholds must be calibrated to your own history: start conservatively, then adjust after you see how many false alarms occur and which real events were missed.
What to observe after each alert: what happened operationally (irrigation, rain, a sector fault), what other zones show, and whether there is a physical explanation in the field. What to verify independently: a quick drip inspection (clogged emitters, a shut sector), a soil check, and a visual canopy check. Practical decision: if the alert shows a zone that enters stress first, intervene locally (pressure/uniformity correction) before changing the entire schedule. Result check: after intervention, the problematic zone’s dynamics move closer to the reference zone over the next cycles.
Conclusion
Blackberry monitoring becomes truly useful when you connect mechanism (roots need oxygen, wetting-front dynamics, wet-leaf periods) to a commissioning protocol: zone placement, independent verification, and trend-based interpretation. This avoids decisions based on the plantation “average” and points you to the exact sections that enter water stress or phytosanitary risk first.
If you want, you can use GrowGuard as a unified platform to view these zones live and historically, with alerts that direct the team to the right place to confirm in the field. Start simple, validate each sensor against real checks, and adapt thresholds to your farm—not to generic recipes.