Blueberries are a crop that tells you quickly when something is off in the root zone: leaves showing “unexplained” deficiency-like symptoms, weak tips, uneven growth, or reduced production. The mechanism is straightforward: the root system is shallow and fine, relying on a small volume of soil or substrate that can dry and salt up fast.
The requirement for acidic soil is not a slogan; it is a physiological condition for nutrient access and for root function with specific symbioses. When pH rises—or when water alkalinity steadily pushes pH upward—nutrient lockout can appear even if the fertilizer program looks correct on paper. Likewise, high EC indicates dissolved salts that increase osmotic pressure and stress roots.
That is why blueberry management becomes more robust when it is tied to measurements taken at the right points: moisture in the real root volume, soil/substrate temperature, and periodic checks of pH and EC in the correct medium. Platforms such as GrowGuard can help with zone-based monitoring and alerts, but the value comes from the protocol: how you measure, where you measure, and how you confirm independently when data looks “too good” or “too bad.”
1) Why blueberries are so sensitive: shallow roots and “tight” chemistry
In field plantings, mulched rows, or container crops with acidic substrate, the active blueberry root zone usually stays close to the surface and within a relatively small volume. That means low buffering capacity: a few hours of water deficit can slow shoot growth, while a few excessive irrigations can reduce oxygen and cool the root zone. In both cases, nutrient uptake often drops before you see obvious wilting.
At overly high pH, some elements become less available or harder to absorb, and symptoms can mimic “fertilizer deficiencies” even when the nutrient supply is adequate. What to observe: chlorosis, unevenness between rows, weak response to fertilization. What to verify independently: soil/substrate testing before planting and water analysis separating pH, alkalinity, and salts. Practical decision: correct the driver (water/medium) first, then adjust nutrition. Check the result: follow root-zone pH trends and uniformity of new growth, not just a short-term greening after intervention.
2) pH, alkalinity, and irrigation water: related, but not the same parameter
In practice, growers often confuse water pH with its tendency to push soil/substrate pH upward. pH is a snapshot; alkalinity describes the bicarbonate/carbonate “reserve” that buffers and raises pH over time. In blueberries, water with meaningful alkalinity can raise root-zone pH even if the measured tap pH looks acceptable. The mechanism usually becomes visible over weeks, not after one irrigation cycle.
What to observe: the medium pH keeps drifting upward and fertilization seems less effective. What to verify independently: a laboratory water analysis that separates pH, alkalinity, and soluble salts (EC); on-farm pH/EC probes should be used as operational checks, not as replacements for lab work. Practical decision: if root-zone pH is rising, adjust the water strategy (for example, a plan to address alkalinity agreed with a specialist) rather than only changing the fertilizer recipe. Check the result: look at a 2–4 week pH trend in a substrate/soil extract, not a single reading.
3) EC in blueberries: what it measures, where to measure it, and how to avoid wrong conclusions
EC (electrical conductivity) indicates total dissolved salts, but it does not tell you which ions dominate, nor does it identify individual nutrients. Also, EC “in source water,” EC “in fertigation solution,” EC “in container leachate,” and EC “in soil/substrate extract” are different measurements with different methods and interpretations. In blueberries, the major risk is making a leaching or feeding decision from a value that does not represent the actual root-zone solution.
What to observe: scorched tips, slow growth, weak response to irrigation—especially in containers or high-evaporation mulched rows. What to verify independently: compare EC of incoming water to EC of drainage (containers) or to a standardized extract from the wetted root zone (field/substrate), using calibrated instruments. Practical decision: if EC in the root zone climbs over time, reduce accumulation through irrigation adjustments (duration/frequency) and, when needed, revise fertigation—without assuming it is automatically “too much nitrogen.” Check the result: a gradual EC decrease in the correctly measured medium and a return of growth rhythm, not merely a normalized EC at the water source.
4) Constant moisture without waterlogging: manage the dynamic, not a fixed number
For blueberries, the common problem is not only “too dry” or “too wet,” but the alternation between them. A sharp dry-down followed by heavy irrigations causes swings in oxygen, temperature, and salinity in a small root volume. In the field, mulch changes water distribution; in containers, acidic substrates can develop uneven wetting or limited drainage zones. This is why moisture sensors are most useful for seeing the rate of decline and the recovery after irrigation, not for chasing a universal target value.
What to observe: unevenness between neighboring plants, growth that comes in “waves,” or patches that stay cool and wet. What to verify independently: physical inspection in the profile (probe/spade check, smell/structure), plus verification of drip flow and distribution uniformity. Practical decision: adjust irrigation frequency to reduce the amplitude of swings, and avoid long runs that push water below the active roots. Check the result: more stable moisture curves in the root zone and reduced plant-to-plant differences, not simply “more water” applied in response to symptoms.
5) A zone-based sensor plan: representative, dries first, cools/wets first
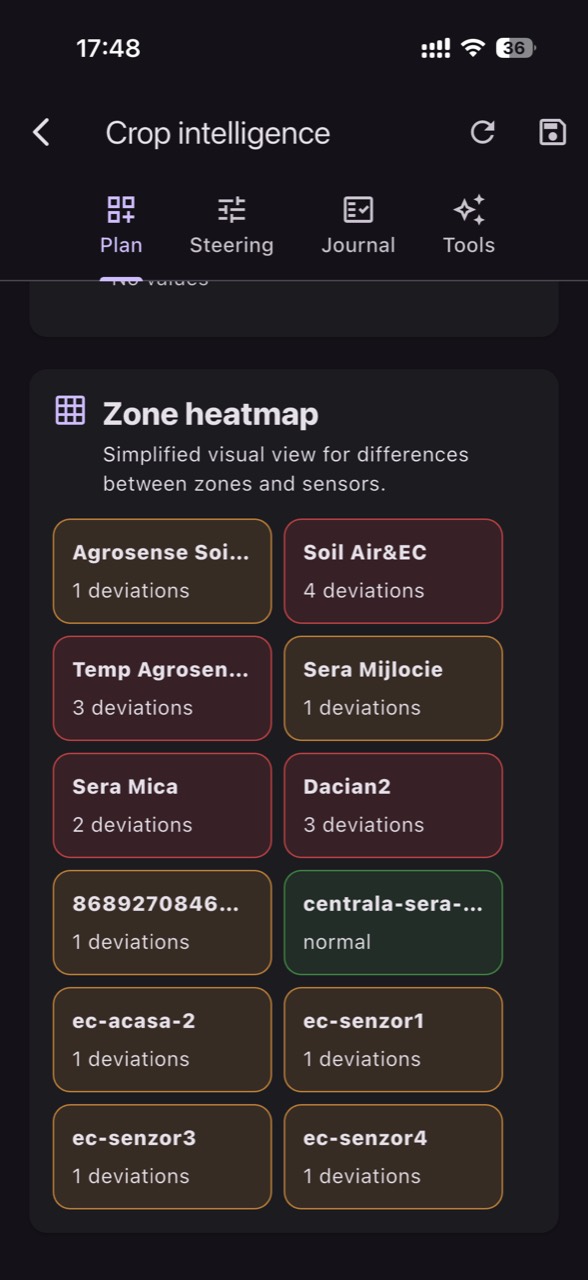
A robust minimum plan for blueberries starts from the assumption that a block is not uniform: you have an “average” zone, one that dries first (sandier texture, higher exposure, end-of-line), and one that stays cooler or wetter (depression, shade, finer texture). Sensor placement should capture these contrasts; otherwise you get beautiful graphs from a spot that does not represent real risk. In GrowGuard, zoning helps you avoid comparing unlike areas and makes deviations between sectors visible sooner.
What to observe: if symptoms appear only in part of the block, the problem is often not the “recipe” but microclimate, texture, or irrigation distribution. What to verify independently: take manual spot checks at several points at the same moments (for example, before the first irrigation and after) to confirm the sensor truly represents its zone. Practical decision: define management zones and zone-specific alert thresholds built from your own history, not universal numbers. Check the result: fewer “false” alarms and better alignment between field reality and what sensors report.
6) Correct probe positioning in the root volume: avoiding the “dripper effect”
A frequent error in drip-irrigated plantings is placing probes too close to the emitter, where fresh water temporarily “washes” EC and can shift local pH abruptly. The outcome is misleading: the sensor shows ideal conditions while active roots—slightly to the side or nearer the surface—are in deficit or sitting in a salt-accumulating band. With blueberries, where fine roots concentrate in the upper layer, a few centimeters can change what you are actually measuring.
What to observe: moisture graphs that jump sharply at every irrigation, while plants still show stress between events or salinity-like symptoms. What to verify independently: locate the wetted bulb in practice (a careful dig/check) and choose positions that stay in the root-active zone rather than the direct wetting jet. Practical decision: place one probe in active roots slightly lateral to the emitter; if you can measure two depths, put one in the upper layer and one just below to detect water moving beyond roots. Check the result: after irrigation, moisture rises look more realistic and EC/pH no longer show short-lived spikes that disappear within minutes.
7) Commissioning pH/EC measurement: calibration, units, and data freshness
pH and EC require dedicated probes and more discipline than temperature or moisture sensing. For EC, always record the units (for example, mS/cm) and the measurement medium (source water, fertigation solution, drainage, or substrate/soil extract). For pH, drift and contamination of the sensing tip can produce plausible but wrong values. Data freshness also matters: a problem that develops today may be missed if a probe reports infrequently or if the last valid reading is from yesterday.
What to observe: abrupt changes that do not fit agronomic reality (for instance, a large pH jump without any intervention) or readings that stay “perfect” regardless of irrigation. What to verify independently: periodic calibration with standard solutions, correct rinsing/handling, and comparison with a separate spot measurement. In GrowGuard, use sensor status/battery alerts and check timestamps so you know you are interpreting current data. Practical decision: if data looks suspicious, do not change fertigation before confirming with an independent measurement. Check the result: after calibration or repositioning, values correlate with events (irrigation, rain, fertilization) in an explainable way.
8) Turning sensors into decisions: diagnosis, action, and post-action control
In blueberries, a good decision typically comes from combining signals: moisture (as a dynamic), soil/substrate temperature (cooling and hypoxia risk), plus pH/EC verified in the correct medium. For example, a zone that stays wet and cold can drive root stress and rot pressure even if it is “not lacking water.” Conversely, a zone that dries first can concentrate salts between irrigations, increasing osmotic stress before obvious leaf burn appears.
What to observe: differences between zones and across times of day; symptoms that repeat in a pattern. What to verify independently: field inspection at the moment the graph shows the extreme (moisture minimum, EC peak), not at a random time. Practical decision: adjust scheduling to the real rhythm (hypothetically, more short irrigations during high evaporative demand) and trigger checks when alerts indicate persistent deviation, not a single spike. Check the result: compare weekly curves before/after the change and note whether growth uniformity improves; if not, revisit the hypothesis and look for other causes (drip uniformity, drainage, texture).
Conclusion
Blueberries reward consistency: an acidic soil/substrate kept stable, moisture managed without large swings, and salinity controlled where roots actually are. The technical key is not to mix different measurements (EC in water versus in drainage/extract; a momentary pH versus a trend influenced by alkalinity) and not to make decisions from a single sensor placed in a “convenient” spot.
If you monitor by zones, treat sensors as diagnostic instruments: validate them with field observations, calibrate pH/EC probes, and follow trends rather than isolated values. GrowGuard can support the routine through alerts and zone comparisons, but results come from your verification protocol and post-action checks. If you want to refine your setup, start with three well-chosen points and build from there.