Cabbage, cauliflower, broccoli, and other brassicas have a growth rhythm that “remembers” stress: one day of water deficit or a spell of cold, wet soil can slow leaf mass formation, and the later catch-up is not always complete. That is why monitoring root-zone moisture is not just about irrigation—it is about keeping the crop on a stable trajectory.
At the same time, brassicas are often grown on heavier soils or in rotations where structure and salinity vary by zone. Two neighboring beds can infiltrate differently, and a single “average” reading pushes you toward the wrong decision. Sensors help only if they are chosen for the right mechanism and commissioned with independent checks.
This article covers the technical fundamentals: what sensors actually measure (and in what units), what “fresh data” means for decisions, how to commission a monitoring setup without imposing an irrigation template, and how to track the effect of interventions in the plants. All examples are hypothetical and must be adapted to your soil, system, and crop stage.
1) Why brassica crop rhythm depends on root-zone stability
Brassicas build a large leaf canopy and, in cabbage, a head that depends on steady water and nutrient supply. When soil moisture oscillates, plants alternate between high uptake and physiological “pause,” which can show up as unevenness between plants and less elastic leaves. Root activity also shifts with temperature, aeration, and compaction, so the same irrigation event does not create the same outcome everywhere in the field or tunnel.
What to observe: visible slowing of growth, slight midday wilting in warm hours, size differences within the same sector, or growth “spurts” after irrigation. What to verify independently: a manual soil check at depth (feel/balling), structure issues (crusting, ponding), and irrigation uniformity (flow, clogging). Practical decision: adjust frequency and duration to avoid dry–wet alternation. Check the result: sensor curves become smoother and size variability narrows over 7–14 days, without ponding after irrigations.
2) Sensor choice: volumetric water content (VWC) vs tension (tensiometer)
For soil moisture, two common families are volumetric water content sensors (VWC, often reported as %) and tensiometers/potential sensors (indicating how “hard” the plant must pull to extract water). VWC is useful to see fast recharge and drawdown after rain or irrigation, but interpretation depends strongly on soil texture. Tension relates more directly to plant effort, yet it can be more sensitive to installation quality and ongoing maintenance.
What to observe in the data: with VWC, look at the amplitude between irrigations and how fast it declines after a peak; with tension, follow the “tightening” trend between irrigations and the recovery after watering. Independent verification: take a simple soil sample from the sensor depth (not just the surface) and note whether the wet/dry feel matches the reading direction. Practical decision: in highly heterogeneous soils, use tension as the primary reference and VWC as support for uniformity. Check: after 2–3 irrigation cycles, the response should be repeatable; if not, suspect placement or poor soil contact.
3) Depth and position: the root zone, not “where it’s convenient”
Brassica roots are concentrated in the upper layer, but the active depth changes with plant age, soil type, and irrigation method. Too shallow makes a sensor over-react to surface evaporation; too deep makes it slow and it may miss stress in the layer roots actually explore. In open field, “in-row” versus “between-row” placement matters, especially under drip. In tunnels, the effect is stronger because microclimate zones shift water use and evaporation patterns.
What to observe: after irrigation, the sensor should show an increase in the expected time window (minutes to hours depending on soil and method), not only the next day. Independent verification: dig a narrow inspection window near the probe 24–48 hours after installation to confirm firm soil contact, no air gaps, no large stones pressed against the sensing area, and no water channeling along the probe shaft. Practical decision: install at least two hypothetical depths (one in the active layer and one slightly below) to separate plant demand from deep percolation. Check: after an irrigation, the shallower depth should respond first; if only the deeper depth moves, distribution is likely problematic.
4) Excess moisture, oxygen and temperature: stress that looks like “thirst”
In brassicas, overly wet soil can reduce oxygen availability to roots, slowing uptake even when water is plentiful. The canopy may look “soft” in hot afternoons, and the instinct is to irrigate again—often worsening the issue. Soil temperature also governs root activity; a cold, wet profile prolongs stagnation. That is why moisture interpretation should be linked with temperature and with how moisture declines between events (plant use versus drainage).
What to observe: VWC staying high for long periods, low tension (soil seems “easy”), yet slow growth and darker foliage; or visible ponding after irrigation. Independent verification: check infiltration with a simple hole/ring test and assess smell/structure for anaerobic signs. Practical decision: shorten irrigation duration and split into smaller pulses to allow aeration; in tunnels, also adjust ventilation to limit extreme surface wetting and evaporation cycles without saturating the profile. Check: after the change, curves show smaller peaks and a decline that looks more like consumption than drainage, and plants regain turgor in cooler hours without ponding.
5) EC and salinity: what you measure, where you measure—and what it does NOT mean
In brassicas, osmotic stress from salts can limit water uptake even when soil moisture looks adequate. But “EC” is not one thing: irrigation-water EC, fertigation-solution EC, substrate/soil extract EC, and bulk-soil EC are different measurements with different interpretations. A temperature sensor does not measure EC, and EC does not tell you which ion is excessive; it indicates total soluble salts in the measured medium. Be explicit about the medium and method whenever you compare EC values.
What to observe: if moisture is steady but plants show stress during warm periods, and moisture curves drop more slowly than expected (reduced uptake), suspect salinity in the root zone. Independent verification: run periodic water analyses and, when needed, laboratory tests for soil or extracted solution; on-site pH/EC checks complement but do not replace lab work, and each measurement type should be logged separately. Practical decision: correlate EC changes with events (fertigation, rainfall, leaching) and adjust application strategy to prevent localized buildup, especially under emitters. Check: after a hypothetical “leaching” event or source change, EC should decline gradually in the monitored zone without chaotic moisture swings that indicate structural or distribution issues.
6) Microclimate and VPD: a useful estimate, not “leaf truth”
In tunnels—or in open field during heat—atmospheric demand can dominate plant water loss. VPD is calculated from air temperature and relative humidity; it estimates how strongly the air “pulls” water from the plant. Caution: leaf temperature can differ from air temperature due to radiation, wind, and transpiration, so VPD is not a perfect description of leaf stress. Still, combined with soil moisture, it helps explain why the same root-zone moisture sometimes coincides with wilting and sometimes does not.
What to observe: the daily hours when VPD rises and whether soil moisture is already dropping sharply in those same hours; repeated stress during high-VPD windows can slow brassica rhythm. Independent verification: inspect leaves at midday (turgor, slight twisting, dullness) and compare zones with different readings. Practical decision: in protected crops, time irrigations so you do not start the day with a “knife-edge” profile, and consider ventilation or shading changes to reduce peaks; in open field, use forecast context to anticipate high-demand days. Check: after adjustments, rapid moisture declines during high-VPD hours are reduced and transient wilting becomes less frequent.
7) A commissioning workflow: from installation to thresholds that don’t create false alarms
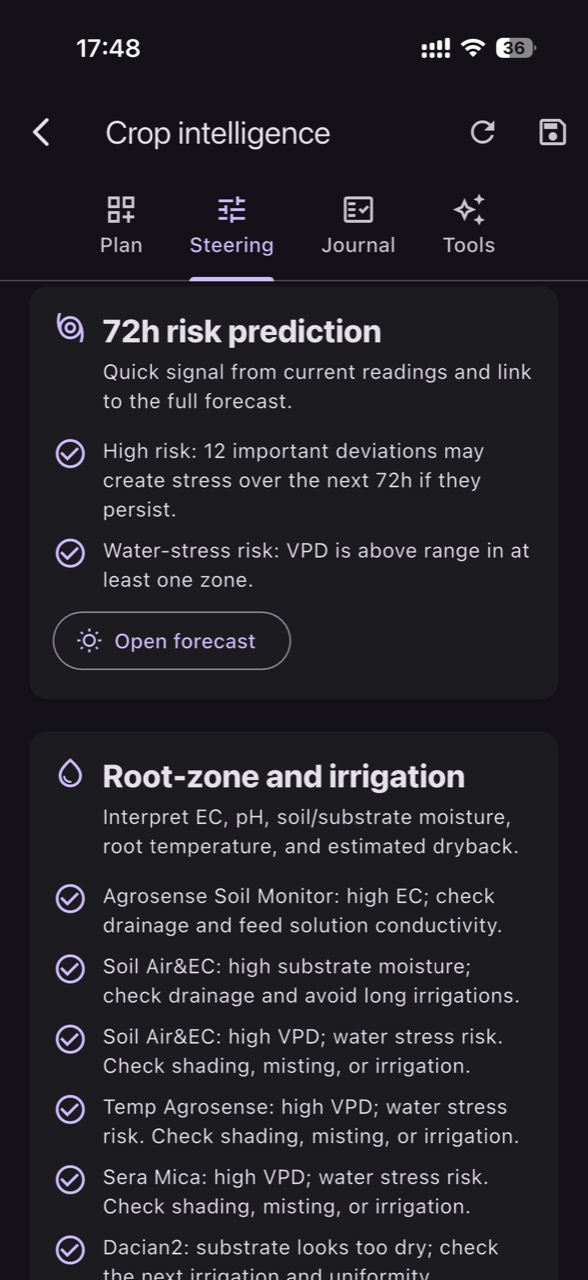
A practical workflow starts with definitions: what decisions the data must support (irrigation timing, uniformity checks, stress detection), what “fresh” means (readings frequent enough to capture irrigation response), and which units you will use consistently. Next, pick a representative zone and a known “problem” zone, and install with documentation: position, depth, soil type, irrigation method, and install date. In GrowGuard, monitoring by crop zones and map-based comparison can help you avoid mixing signals from different sectors while you validate behavior.
What to observe in the first 7–10 days: immediate response after irrigation/rain, unexplained drift, stuck values, or impossible jumps. Independent verification: keep a simple log of irrigation times and approximate amounts, plus 2–3 soil inspections near the probes. Practical decision: set alerts only after you learn the sector’s normal “signature” (what a good day versus a problematic day looks like), not on day one. Check: if alerts trigger when real events happen (missed irrigation, dry sector, rainfall), thresholds are becoming useful; if triggers are random, revisit placement or data frequency before changing irrigation practice.
8) Failure cases and rapid diagnosis: the sensor or the crop?
The most common practical failures are poor soil contact (air gap), a probe installed outside the wetted zone, wrong depth, damaged cable/probe, or data that is too sparse to capture events. During intense rainfall, water can preferentially run along the probe shaft if the soil was cracked during installation, creating a false spike. Another case is very stony soil or residues that physically separate the probe from the soil matrix it is meant to represent.
What to observe: values that do not change at all after irrigation, sudden jumps without any event, or huge differences between two nearby sensors with no agronomic explanation. Independent verification: repeat a controlled response test (hypothetically, irrigate 10–20 minutes and watch whether the sensor reacts) and physically inspect placement; also confirm the area is truly irrigated uniformly (pressure, flow, clogging). Practical decision: before changing your irrigation recipe, treat it as a measurement problem and validate with a second source (manual probe, tensiometer, soil sample). Check: after correcting installation, the signal aligns with events and field observations; only then use trends for decisions.
Conclusion
For cabbage and brassicas, the goal is not a “perfect moisture number,” but controlling the variations that break crop rhythm: dry–wet alternation, prolonged saturation, localized salt accumulation, and peaks in atmospheric demand. Sensors become valuable when they are selected correctly (what they measure, in what medium), installed in the true root zone, and validated with independent checks until the signal is repeatable and explainable.
If you want to operate by zones and quickly connect irrigation timing, microclimate, and sensor history in one view, GrowGuard can support this commissioning discipline without replacing field observation. Invite your team to record events and test hypotheses against the data—brassica consistency is built through verification, not assumptions.