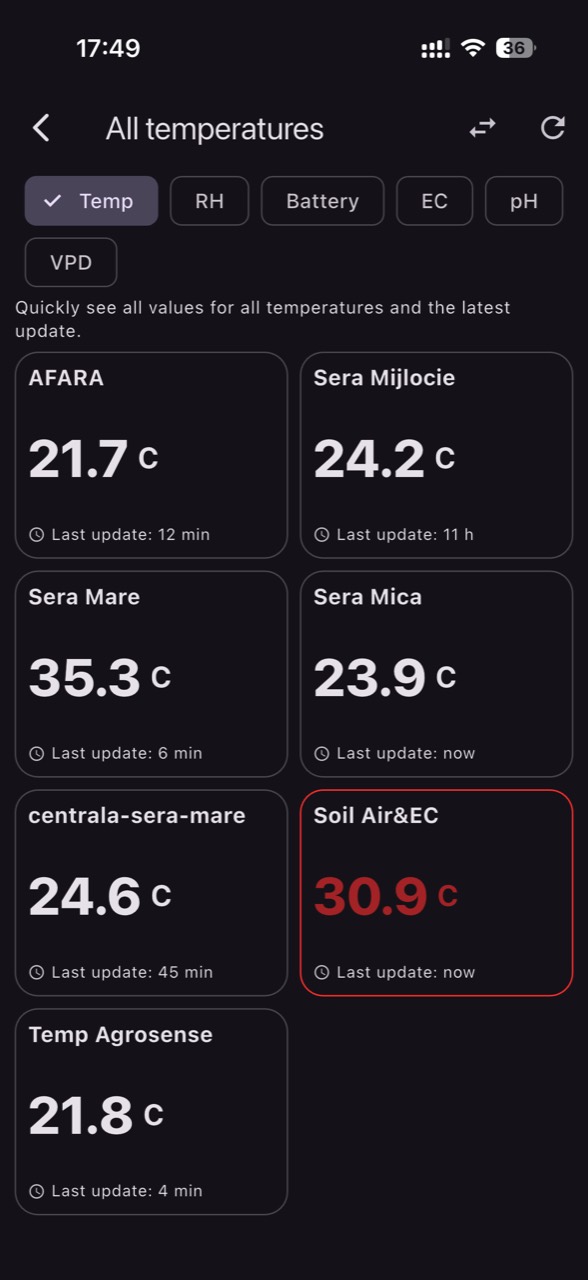
In cherry and sour cherry orchards, microclimate can change over short distances: a cold hollow, a windy ridge, or a corner with heavier soil. This is where most “false alerts” come from—not because the sensor is lying, but because it is accurately measuring a point that is not representative for the decision you need to make.
During critical periods (from bud break through ripening), two phenomena dominate risk: late frosts, and wet intervals that raise disease pressure and can favor cracking in cherry or rots in sour cherry, depending on timing. Temperature, humidity, and leaf-wetness sensors can separate a real orchard risk from the impression created by a weather station placed “near the yard.”
This is a diagnostic guide: for each problem, you’ll see the mechanism, what to look for in the data, what to verify independently in the orchard, a practical decision you can make, and how to check afterward whether the intervention worked. The goal is not to impose universal thresholds, but to help you build thresholds based on cultivar, phenological stage, duration, and block history.
1) Frost: the difference between “warm air” and damaged buds
Orchard frost is often a stratification phenomenon: colder air drains into low areas, and temperatures at canopy level can differ from a sensor mounted too high, too close to a road, or beside a building. In cherry and sour cherry, sensitivity changes sharply with phenology; a relevant threshold must be chosen from local stage-specific guidance for your crop and cultivar and linked to exposure duration, not only to an instantaneous minimum.
What to observe and verify: compare the temperature curve in a low area with one in a “mid-slope” part of the block; a real frost often shows a gradual drop, then a flatter period near freezing, then a slow rise after sunrise. Independently verify with a reference thermometer placed next to the sensor, and inspect buds/flowers (cutting) after the event. Decision: activate protection when temperature approaches your chosen stage threshold and forecast suggests persistence. Result check: log time below threshold and later compare fruit set percentage across the monitored zones.
2) Placing temperature sensors for frost: cold spots, not convenient spots
A frost sensor placed “where there is signal” may be good for connectivity yet poor for decision-making. In orchards, you want first a point representative for risk: a low zone prone to inversions, a wind-exposed zone (greater convective cooling), and—if possible—a control point in an area considered “safer.” For cherry and sour cherry, these differences can also mean shifted phenology and different responses to the same cold night.
What to observe and verify: if the “cold spot” sensor is always 2–3°C lower than others, it may be real (microclimate) or it may be poor installation (direct radiation effects, mounted on metal). Verify: adequate shielding from sun, distance from trunks/branches, height relevant to sensitive organs, and whether the sensor is naturally ventilated. Decision: set separate alerts by zone rather than one threshold for the entire orchard. Result check: after a cold episode, compare the damage map with the minimum-temperature map; if they don’t align, re-evaluate placement.
3) Air humidity and VPD: when “high humidity” doesn’t mean wet leaves
Relative humidity (RH) describes how close air is to saturation, but it does not directly say whether there is water on leaves or fruit. VPD (vapour pressure deficit) derived from air temperature and RH is an estimate of the air’s drying power; in orchards, leaf temperature can differ from air temperature, especially under sun or wind. In cherry and sour cherry, these differences influence transpiration, stress, and how fast canopies dry after rain or dew.
What to observe and verify: a night with very high RH may not produce long leaf-wet periods if wind persists and the canopy is open; conversely, in shaded, dense areas, leaves can remain wet long after RH has dropped. Independently verify by checking leaves/fruit early morning and noting the time they dry in different rows. Decision: use RH/VPD as context (drying potential) and leaf wetness as the surface indicator. Result check: after pruning for airflow or irrigation changes, track whether leaf-wetness duration shortens under similar weather.
4) Leaf-wetness sensor: the most common misleading readings
A leaf-wetness sensor is useful to approximate periods when surfaces remain wet, which influences risk for some diseases (for example, brown rot) and spray performance. But it is also one of the easiest sensors to “mislead” by placement: if mounted too exposed to the sky, it can condense more; if tucked under dense foliage, it can stay wet artificially; if close to sprinklers, it can confuse irrigation with dew or rain.
What to observe and verify: a warning sign is leaf wetness that “starts” before RH rises in the evening, or stays at 100% through sunny days with no precipitation. Verify: mounting angle (similar to a real leaf), orientation toward the sky, distance from direct water sources, and surface cleanliness (deposits/dust). Decision: if the decision is about spraying, always correlate with observed rain and real canopy drying in the block, not only a single curve. Result check: after repositioning, compare two similar days; the curve should show wetting overnight and progressive drying, not permanent wetness.
5) Soil moisture: separating real stress from a poorly installed probe
In cherry and sour cherry, water stress during key periods can affect set, sizing, and firmness, while excess water can reduce root aeration and amplify physiological issues. Soil-moisture sensors are valuable only if they measure the soil volume explored by roots. A probe inserted into compacted soil, a crack, near a dripper, or into an atypical layer can report “drought” or “saturation” that does not represent the tree.
What to observe and verify: a typical drip-irrigation graph shows rises after irrigations and declines between them; if the line is nearly flat for weeks, you may have poor soil contact, an unsuitable depth, or an irrigation sector that does not reach the measurement point. Independently verify with a spade check (feel and structure by depth), observations of vigour/leaf elasticity, and irrigation uniformity (flow, clogging). Decision: adjust duration/frequency based on trends, but confirm with a physical check on the day of the alert. Result check: after changing the schedule, see if the expected response appears within 24–48 hours on the same probe and in field observations.
6) EC and pH: what they measure, where they’re measured, and why methods aren’t comparable
Fruit quality and tree health can be influenced by salinity and solution reaction, but this is where confusion is common. A temperature or humidity sensor does not measure EC/pH; you need dedicated probes. Also, “EC” is not a single universal number: EC in irrigation water, EC in fertigation solution, EC in soil pore water (in-situ), EC from a soil extract, or EC from a laboratory soil method are different measurements in different media, with different interpretations.
What to observe and verify: a higher in-situ EC after fertigation can be normal short-term in the wetted zone, but becomes risky if it stays elevated and accumulates, together with symptoms (marginal scorch, slowed growth) or reduced water uptake. Independently verify by assessing source water separately (pH, alkalinity, soluble salts), and when needed confirming soil salinity/structure with laboratory methods; do not draw conclusions from one method alone. Decision: before making corrections, establish a baseline using your chosen method (same probe, same depth, same timing). Result check: after a flushing irrigation or recipe adjustment, follow the trend over weeks and validate with an independent check (water or soil) from the same block.
7) “Fruit quality” from data: temperature, rain, irrigation, and wrong conclusions
Sensors do not directly measure firmness, Brix, or cracking, but they can explain why differences appear between blocks. In cherry, cracking risk increases when fruit takes up water rapidly (rain close to ripening, high-humidity periods, or heavy irrigations after a dry spell). In sour cherry, quality pressure is often seen as rots and harvest losses when wet periods are prolonged. The mechanism differs in commercial impact, but the useful data are similar: wetness duration, rainfall events, and soil-water oscillations.
What to observe and verify: a misleading interpretation is blaming cracking only on rain when there was actually a sudden soil-moisture increase from irrigation in the same window. Independently verify by logging phenology (onset of colour change/ripening), rain events, and irrigation volumes; take hypothetical samples from two zones (same cultivar and rootstock) and compare the share of cracked/rotted fruit. Decision: in sensitive windows, avoid large swings in soil moisture and prioritise uniformity. Result check: follow the blocks across 2–3 irrigation cycles to see whether variability amplitude decreases and differences between zones narrow.
8) Rapid diagnostic protocol: crop problem or equipment/data problem
When a reading looks “impossible,” treat it as a three-step investigation: (1) physical plausibility (does it match weather, time of day, other variables?), (2) spatial coherence (do other points in the orchard show something similar?), and (3) temporal coherence (did it change abruptly after an intervention—mowing, spraying, moving hardware, rain, irrigation?). In orchards, most errors come from mounting, shielding, poor soil contact, cable/connector issues, or insufficient maintenance.
What to observe and verify: a hypothetical example is a 6–8°C temperature “drop” in two minutes with no meteorological change; that suggests a sensor, power, or transmission problem more than real frost. Verify in the field: a photo of the placement, bracket integrity, cleanliness, and possibly a second reference instrument. Decision: don’t change irrigation or frost protection based on a single spike; seek confirmation from a second point or field observation. Result check: after correction (repositioning/replacement), monitor 3–5 days to see whether the variable returns to a logical pattern and alerts become rare but relevant. If you use GrowGuard, separate alerts by zone and enable status/battery alerts to quickly distinguish missing data from real risk.
Conclusion
A good sensor system in cherry and sour cherry orchards is not about having many numbers, but about numbers interpreted in context: phenology, topography, soil type, and block history. When you build thresholds based on cultivar and event duration, verify independently in the field, and confirm after interventions, you greatly reduce the risk of acting on misleading “signals.”
If you want, a platform like GrowGuard can help you compare microclimates by zone and keep the history needed for validation (especially after frost or wet spells). A short seasonal audit of placement and data logic is often the most cost-effective “intervention” you can make in the entire monitoring system.