In cherry and sour cherry orchards, the same night can mean two realities: blossoms exposed to frost in a low spot and buds still safe on a ridge a few hundred meters away. Differences in relief, wind and humidity translate directly into set, losses and an uneven harvest. That’s why monitoring must be done “in the block,” not from the yard.
Air humidity, leaf-wetness periods and canopy temperature influence not only disease risk, but also the real intervention window. In addition, as cherries approach ripening, a different sensitivity takes over: rain or persistent humidity can reduce firmness and increase cracking risk, and decisions become fine-grained—made by the hour, not by the day.
A useful sensor system is not about many devices; it’s about a clear protocol: what you measure, in which units, where you install, how fresh the data is, and how you verify the sensor is telling the truth. Below are the technical fundamentals and a commissioning workflow for frost, humidity and fruit-quality-related indicators, adaptable to different orchard blocks.
1) Late frost: what to measure and why sensor height matters
In cherry and sour cherry, early phenological stages (bud swell, white bud, bloom) can be hit by short but critical frosts. The mechanism is straightforward: cold air drains downhill and pools in low areas, and temperature inversions can make small elevation changes produce large differences at flower level. What to observe is the overnight minimum, the duration below a chosen threshold, and the cooling rate (how fast temperature drops).
Independent verification should combine a reference thermometer (even a simple one, but compared side-by-side) placed in the same position, plus morning scouting: blossom appearance and pistil condition, uniformity along rows, and whether damage matches the coldest zone. The practical decision is to trigger protection based on temperature at the critical height (roughly the blossom zone), not a “standard” 2 m reading. After the event, check whether the sensor’s minimum aligns with the damage area; if not, suspect placement or radiation shielding issues.
2) Placing temperature sensors: microclimate, shielding and the “cold zone”
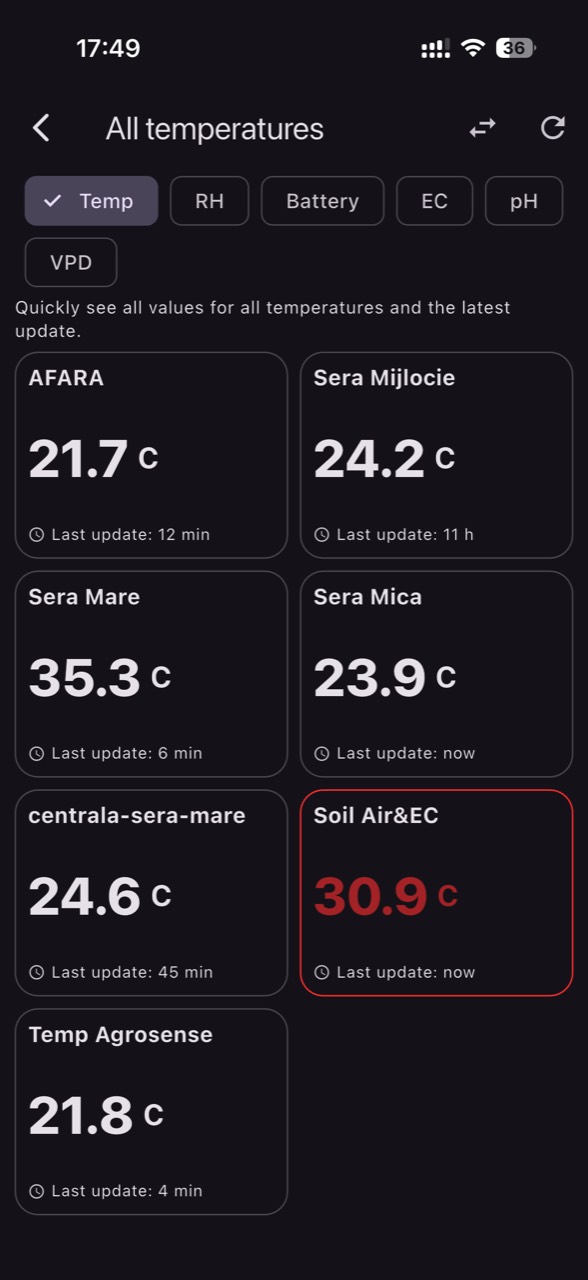
The most common mistake is making decisions from a weather station near buildings while the low orchard block has a different microclimate. For frost, choose at least two points: a “cold zone” (depression, valley bottom, near a windbreak) and a comparison point (ridge, well-ventilated area). The sensor must be shielded from radiation and mounted so it samples air, not a sun-warmed surface.
Independent checks in the first cold nights are simple: compare curves between points and look for artifacts (jumps, flatlines, physically implausible values). If one sensor reads consistently warmer after sunrise, it may be in direct sun or mounted too close to a trunk or metal. The practical decision is to define different alerts by zone: what is safe on a ridge may be critical in a hollow. Check results through consistency: the cold zone stays colder on calm nights, and on windy nights the gap narrows.
3) Air humidity and VPD: how they affect fruit and disease pressure
Relative humidity (RH) and air temperature describe how easily the plant loses water; from them you can estimate VPD (vapor pressure deficit), but remember leaves and fruit can differ in temperature from the air. In cherry/sour cherry, long episodes of high humidity and stagnant air increase infection risk and keep surfaces wet, while very dry air episodes can accelerate transpiration and amplify water stress during sensitive periods.
Independent verification means field observations: whether dew forms in the morning, how quickly leaves dry after rain, and whether sensor data matches reality (RH near saturation overnight should correspond to dew). The practical decision is not “one threshold,” but a routine: when you accumulate many hours of very high RH, schedule scouting and reassess spray/work windows or canopy operations that influence humidity. Check the outcome by tracking reduced leaf-wetness duration after orchard practices (for example, canopy opening through pruning) and by seeing smaller differences between rows.
4) Leaf-wetness sensor: useful, but only if commissioned correctly
Leaf wetness is not only rain; it can be dew or condensation that maintains the thin water film many diseases need for germination and infection. A leaf-wetness sensor is sensitive to location, angle, exposure, and calibration approach (some report “wet/dry,” others an analog value). What to observe is the start and end of wet periods, not just a daily total.
Independent verification during the first two weeks should include visual checks at key times (for example, before sunrise and after direct sun hits the canopy) and comparison to the sensor. If the sensor reports “wet” at midday without clouds or rain, it may be in deep shade or too close to overhead sprinklers. The practical decision is to use leaf-wetness duration together with temperature and RH to prioritize blocks for phytosanitary checks. Validate by correlation: after a rain, a sensor in a more open canopy should dry faster than one in a dense canopy.
5) Soil moisture: choosing the sensor type and the right depth
In cherry and sour cherry, water stress in critical periods can reduce fruit growth and affect firmness, while excess water can reduce root aeration and favor physiological problems. A soil-moisture sensor (capacitive/volumetric) measures water content in the soil volume around it; it does not directly measure “what the plant can absorb.” What to observe is the trend between irrigations/rain, drainage speed, and differences across textures (sandy versus clayey soils).
Independent verification comes from profiling the soil with a hand probe or a narrow pit to see the depth of active roots and whether water is reaching where it should. Good commissioning includes two depths (one shallower for active/younger roots and one deeper for reserve), within the same wetted irrigation zone. The practical decision is to start/stop irrigation based on the curve (when depletion accelerates and the tree draws from “reserve”), not the calendar. Check results: after irrigation, the shallow sensor rises quickly; the deeper one rises only if infiltration is sufficient and not lost laterally.
6) Soil temperature: growth start, uptake, and interpretation pitfalls
Soil temperature influences root activity, mineralization and water dynamics. In spring, cold soil can delay uptake, so a quantitatively “correct” irrigation may still not translate into plant comfort. In summer, very warm soil can accelerate water use and intensify stress, especially where mulch is thin or soil is exposed. What to observe is the weekly trend and differences between soils and exposures, not an isolated number.
Independent verification compares soil temperature with field observations (moisture by feel, growth activity, possible midday wilting symptoms) and with the block’s historical behavior. The practical decision is to adjust irrigation timing (for example, avoiding irrigations that unnecessarily chill the root zone during sensitive periods) and to prioritize practices that stabilize soil microclimate (ground cover, managing the herbicide strip). Check results through reduced daily soil-temperature amplitude and more even water-use patterns in the sensor curves.
7) Fruit quality: what sensors can tell you and what must be measured separately
“Quality” in cherry/sour cherry typically means size, firmness, uniformity, appearance and rain behavior (including cracking). Orchard sensors do not directly measure sugar or firmness, but they can explain the context: episodes of water stress, wet–dry alternations, and long humid periods that keep fruit wet. What to observe is how long the microclimate remains humid after rainfall, and how differently it behaves between blocks.
Independent verification requires consistent physical measurements (hypothetical example: a refractometer for Brix on a comparable sample, a dedicated firmness tester or a standardized assessment), plus noting cracking incidents by zone. The practical decision is that if data shows one block stays wet much longer (leaf wetness and high RH), you prioritize protection there (for example, covers, canopy management) and avoid irrigations that add humidity during risk windows. Check results by zone comparison: the same rain event, but different wetness duration and different percentages of affected fruit.
8) A commissioning workflow by block: data freshness, thresholds and failure tests
A practical protocol starts by defining “decision zones”: blocks with different soils, low frost-prone areas, and wind-exposed rows. Then you choose sensors: air temperature (with shielding), RH, leaf wetness, soil moisture and, where it makes sense, soil temperature. Set the reporting interval (fast events require sufficiently fresh data), and verify units and time synchronization across devices so you are not comparing the wrong hours.
Failure tests are mandatory: simulate an alert (temporary threshold) and confirm who receives it and how quickly; check battery and signal as part of routine. In platforms such as GrowGuard, it is useful to compare zones visually on a map and set zone-based alerts rather than “whole-farm” alerts. The practical decision is to run 2–3 weeks in an observational mode—without changing everything at once—then adjust thresholds based on correlation with what you see in the orchard. Check results with a short log: event (frost/rain), decision taken, what you found the next day, and whether sensors correctly described differences between blocks.
Conclusion
Sensors become truly useful in cherry and sour cherry orchards when treated as field instruments: correct placement, commissioning with independent checks, and zone-based interpretation rather than averages. Frost is managed using temperature at the critical height and the cooling dynamics; humidity and leaf wetness demand attention to duration and microclimate; soil must be followed as a trend and profile, not a single number.
A well-set system does not promise “universal settings,” but a repeatable method: measure, verify, decide, then verify the result again in the orchard. If you want to see block-to-block comparisons and receive location-coherent alerts, GrowGuard can serve as a monitoring and history platform; the next step is to define your zones and commission sensors with a validation log, season after season.