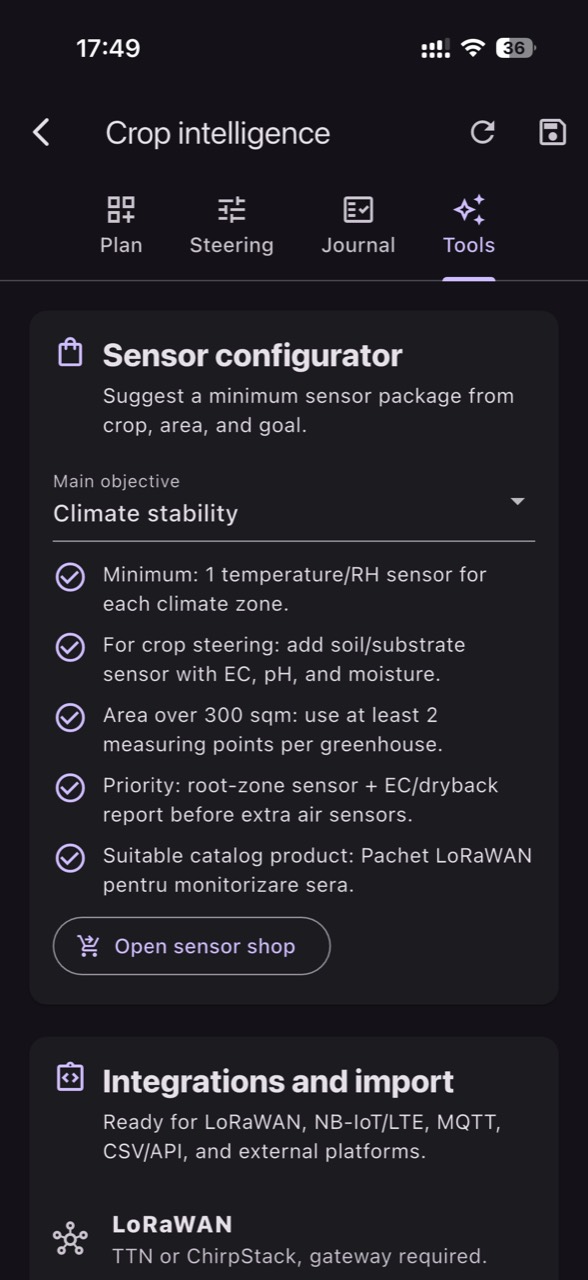
In a crop, a nice-looking chart does not automatically mean truth. Readings can be correct but irrelevant (a sensor placed in the “wrong” spot), or relevant but incorrect (drift, poor contact, deposits). The difference shows up when you treat the sensor as a diagnostic instrument, not as a technological ornament.
Choosing sensors starts with the agronomic question: what decision do you want to take tomorrow morning based on the data? Irrigation, fertigation, ventilation, frost protection, salinity management, zone uniformity. When the question is clear, the measurement medium becomes clear too: water, nutrient solution, substrate, soil, air, leaf.
This approach emphasizes placement and microclimates: two points 30–50 m apart can behave completely differently, and a single sensor can “lie” without being broken. Below is a practical protocol: what to observe in the crop, what to verify independently, what decision to make, and how to confirm afterward whether it was right.
1) Start from the decision, then choose the sensor type and measurement medium
The most common mistake is buying sensors by protocol (LoRaWAN, NB‑IoT, MQTT) instead of by the agronomic problem. Define the decision first: “Do I change irrigation timing?”, “Do I adjust fertilizer injection?”, “Do I vent earlier?”, “Do I have a cold zone with frost risk?”. Then choose the physical variable and its location: air at leaf level, fertigation solution, incoming water, pot substrate, or soil in the active root zone.
When you compare pH and EC, state explicitly what you are measuring. pH/EC in well water, pH/EC in fertigation solution, EC from a substrate extract, and bulk-soil EC are different measurements with different meanings; don’t mix them into one conclusion. pH describes solution reaction, and EC reflects dissolved salts but does not identify individual nutrients. Lab analysis remains relevant for context; on-site monitoring complements it, not replaces it.
2) Crop zones and microclimates: how to know how many sensors you need
A crop is rarely uniform: row ends, tunnel edges, areas by doors, walls, thermal screens, heat sources, soil texture changes, or different drip pressure. Divide the site into “decision zones” that behave similarly. One sensor does not represent the whole crop; it represents a point. The goal is to pick points that explain variability, not to chase an “average value.”
Comparing microclimates is the fastest way to catch misleading readings. Hypothetical example: one temperature sensor is consistently 2–3°C higher than another, but plants don’t show heat stress, and the difference persists day and night. Suspect placement (direct sun, near a motor, in a warm air stream) or insufficient shielding. If the difference appears only at noon, check direct radiation and reflections; if only in the morning, check air stratification and proximity to ventilation.
3) Climate sensor placement: avoid “sun on plastic” and the wrong air
Temperature and humidity sensors must “see” the air that the leaf sees, not the roof or the wall. Mounting near film, in direct radiation, next to a fan, or in a stagnant corner can create artificial microclimates. VPD calculated from air temperature and relative humidity is an estimate; leaf temperature can differ (cooler via transpiration, warmer under stress), so don’t make drastic conclusions from a single number.
For diagnosis, follow the mechanism: if VPD looks “too high,” look for signs consistent with reduced transpiration (slight tip wilting, closed stomata, slowed growth). Verify independently with a handheld thermometer/hygrometer at the same point and height, plus a visual check of air movement. The practical decision may be adjusting ventilation/shading or irrigation intervals; confirm the result via trend stabilization and plant response over 24–48 hours, not immediately.
4) Soil/substrate moisture: positioning by depth and relative to the dripper
A moisture sensor installed too close to the dripper will look “perfect” even if roots elsewhere are suffering; installed too far, it may show drought while the active root zone is wet. In soil, depth must reflect the active root zone, which changes over time; in substrate, position relative to the pot wall changes drainage and aeration. For sensitive crops (for example, tunnel vegetables or berry shrubs), moisture uniformity matters both for nutrition and for physiological risk (cracking, flower abortion, tip burn).
When a reading looks “odd,” check the timeline mechanism: after irrigation you should see a rise, then a gradual decline. If there is no response after watering, it could be the sensor (poor soil contact, cable issue, drift), but it could also be irrigation (a shut sector, clogged drippers, insufficient pressure). Verify independently: physically inspect dripping, dig a small section to see the wetting front, or use a manual probe. Decide to repair irrigation or adjust runtime; confirm via repeatable response over the next 2–3 irrigations.
5) EC and pH: same acronyms, different problems when you change the medium
EC and pH are only useful if you know exactly where they are measured. In incoming water, EC indicates total salt load; in fertigation solution, it reflects the recipe at that moment; in drainage or substrate, it reflects salt accumulation and leaching. Problems appear when you directly compare “soil EC” with “water EC,” or assume an EC spike automatically means “too much fertilizer.” A temperature sensor does not measure EC/pH; you need dedicated, maintained probes.
Practical diagnosis: if EC in the root zone rises, look for crop signs compatible with salinity stress (especially in sensitive species or young plants): slowed growth, marginal necrosis, difficult water uptake. Verify independently with a manual measurement of solution (tank, irrigation line) and, if needed, with a consistent substrate/soil extraction method repeated the same way each time. The decision may be adjusting leaching, irrigation frequency, or the recipe; confirm with a downward trend over the next days and improved vigor, not an instant “perfect number.”
6) Connectivity and data freshness: when the issue is the network, not the crop
A correct reading that arrives late becomes dangerous: you make decisions on the past. Data freshness depends on transmission interval, signal stability, and “missing data” alerts. On farms and plantations, LoRaWAN can provide good coverage with a well-placed gateway; NB‑IoT can help in remote areas where you have cellular coverage; MQTT is common in automation projects or when you want status checks in a local system. There is no universally “best” protocol—only the best fit for your conditions and decision rhythm.
When you see gaps or “frozen” values, separate three causes: a stuck sensor, power/battery, or a radio link issue. In your platform, check whether one value stays identical for hours while conditions should change; then verify the sensor and environment physically. Hypothetical example: air humidity stays at 55% all night in a tunnel with changing irrigation and ventilation; reporting is more likely than a perfectly stable microclimate. Decide to change transmission scheduling or move the gateway; confirm by returning to plausible patterns and consistent status alerts (including in GrowGuard, if you use it).
7) Commissioning: short tests that catch 80% of placement and interpretation errors
In the first days after installation, don’t “calibrate” the crop to the sensor; calibrate your trust in the sensor. Do a signal test before final mounting and document each point on a map with height, orientation, and crop zone. Then run challenge tests: for climate, intentionally change airflow (open a door/vent in a controlled way) and see whether the sensor responds; for soil, do a short irrigation and track the response; for pH/EC, periodically compare against a manual reading of the same solution.
When inconsistencies appear, use a simple diagnostic matrix: expected mechanism, crop-observable sign, independent verification, decision, post-decision check. If it “should” cool at night but the sensor doesn’t drop, check shielding and position (it may be above a heat source). If soil moisture shows drought but plants are turgid and soil feels wet, suspect soil contact or wrong depth. Confirmation does not mean perfection; it means repeatable behavior consistent with biological processes.
8) Typical “false alarm” vs real problem cases: how to tell quickly
False temperature alarm: a sudden noon spike at a single point, with no effect in the rest of the zone and no plant symptoms. Likely mechanism: direct sun on the housing or reflection from film. Verification: temporarily shade the sensor, take a manual measurement at the same point. Decision: reposition or improve shielding. Result check: the disappearance of “sawtooth” spikes and convergence with sensors in similar zones.
A real issue masked by a “good” sensor: all values look normal, but you see heterogeneity in the crop (for example, one row with weaker growth). Likely mechanism: a local microclimate (air stream, shade, drainage) or uneven water/fertigation distribution. Verification: temporarily move a mobile sensor or compare two nearby points in the same zone; check pressure and flow at line ends. Decision: adjust sector irrigation or correct air circulation. Confirmation: trend uniformity between points and reduced visual differences in 1–2 weeks, depending on crop.
Conclusion
Choosing the right sensors is not about checking off a list of parameters; it is about building a diagnostic: what you measure, where, how often, and how you verify that the measurement reflects biological reality. Placement, zone definition, and microclimate comparison multiply data value; without them, even a good probe can push you into the wrong decision.
If you want to see readings in zone context and compare microclimates easily, you can use GrowGuard as a monitoring and alerting platform. The core discipline stays the same: start from the agronomic problem, verify independently, take a small decision, and confirm the effect in both data and crop.