In drip irrigation, a small problem becomes a big one quickly: a single partially clogged line can create a chronically dry patch, while a valve stuck open can keep roots in excess water. The difference between “it seems fine” and “it is fine” is measurement: what happens to water in the pipe, and what actually reaches the root zone.
Fast detection is not about watching a single moisture number. It is about correlating signals: when irrigation starts, how long it runs, how soil/substrate reacts, and whether the response is uniform across a sector. A good alert system shortens time-to-diagnosis, but only if it is commissioned correctly and validated with independent checks.
The article below covers the fundamentals: which sensor types make sense for clogs, non-watering sectors, or overwatering; what to look for in graphs; what to verify in the field; and how to make a practical decision. The protocol is commissioning-oriented: establishing units, data freshness, thresholds, and a confirmation method after each intervention.
1) Three faults, three mechanisms: where the water “disappears”
Clogged drippers are a point-level flow restriction: line pressure can look normal, yet water no longer exits uniformly. A sector that does not irrigate is usually a control/hydraulic issue: a solenoid valve does not open, a main filter is blocked and limits the entire sector, or there is a restriction on the supply manifold. Overwatering happens either from scheduling (too often/too long) or from a fault (leaking valve, back-siphoning, excessive pressure).
What to observe: faults show up as a mismatch between the “irrigation event” and the root-zone response. With clogs, some points do not respond or respond slowly; with a non-watering sector, nothing responds anywhere in that sector; with overwatering, moisture stays high for a long time and does not return to a normal aeration level. Independent verification: a cup/volume check at line ends, a quick pressure check, and inspection of filtration. Decision: isolate whether it is line-level or sector-level before changing the irrigation schedule.
2) Sensor choice: what each measures—and what it cannot prove
For fast diagnosis you need at least two perspectives: water in the system and water in the root zone. Soil/substrate moisture sensors (volumetric or tension-based, depending on your situation) show the root-zone response to irrigation, but they do not directly prove that flow rates are correct. A flow sensor or sector water meter shows that water passed through the sector, but it cannot guarantee distribution at each dripper. Pressure sensors can indicate a restriction or a closed valve, yet they may miss point clogs.
You also need to separate the growing medium: moisture in soil is not the same as moisture in an inert substrate; irrigation response and drainage speed differ. Likewise, EC and pH are distinct measurements requiring dedicated probes; an air temperature or humidity sensor cannot measure EC/pH. When you use EC to interpret overwatering or leaching, state the method and medium (fertigation solution, drain, substrate extract, or bulk-soil measurement); these are not interchangeable.
3) Diagnosis-oriented placement: “reference,” “ends,” and “middle”
To detect clogs and non-watering, sensor placement must capture non-uniformity. A practical commissioning rule is to have one “reference” point in an area that historically seems stable, plus two points within the same irrigation zone: one near the supply and one toward the end. In soil-grown crops, place the sensor within the root-explored volume, not outside the wetted band. In substrates, the position relative to the dripper and to drainage strongly affects interpretation.
What to observe: if the reference reacts but the end does not, suspect progressive restriction along the run, clogging, or pressure differences. If neither reference nor ends react, suspect a sector-level failure (valve, filter, pump, schedule). Independent verification: physically mark sensor locations and compare with a quick moisture spot-check (hypothetically, a manual probe or a small inspection hole) immediately after irrigation. Decision: fix infrastructure first (filters, flushing, repairs), then tune alert thresholds.
4) Data freshness and the irrigation event: without “time” there is no diagnosis
An alert system only works if you know the data are fresh and you can identify when irrigation truly happened. For clogs, you need enough time resolution to see the post-start “step” in moisture; if a sensor reports too rarely, you may only see a broad trend and confuse reporting delay with lack of irrigation. For flow/pressure, the irrigation event must align logically with the root-zone response—otherwise alerts become noise rather than diagnosis.
What to verify: before setting thresholds, run a controlled irrigation cycle (hypothetically: 10–15 minutes in one sector) and check whether the expected signal appears within one or two reporting intervals. If it does not, the issue may be installation (wrong depth, poor soil contact, sensor placed outside the wetted area) or telemetry. Decision: define a minimum data frequency requirement for reliable alerts (more frequent during periods with frequent irrigation). Confirm by repeating the controlled test.
5) Graph signature for clogged drippers: weak response, not zero
Partial clogging has a typical signature: irrigation starts, but the moisture increase is smaller than normal or delayed, while the post-irrigation decline slope remains “normal” (plant uptake and drainage continue)—just from a lower peak. If you have two sensors in the same zone, one may show a clear step-up and the other almost none. This relative difference is often more diagnostic than any absolute moisture value.
Independent verification: check uniformity quickly (hypothetically: collect 1–2 minutes of discharge from several drippers, including the line end, and compare volumes) and inspect the secondary filter and line ends for deposits. Practical decision: flush lines, clean filters, replace a section or drippers, and investigate the cause (sand, precipitates, biofilm). Confirmation: after intervention, repeat the controlled irrigation and verify that the moisture “step” returns to a profile comparable with the reference point.
6) Signature for non-irrigating sectors: “no flow, no response”
When a sector does not irrigate, the absence is global: you see no increases in soil/substrate moisture at any point in that sector, and if you have a flow/pressure meter the signal shows either zero or far below expectations. Watch for traps: if rain occurred or someone did local manual watering, moisture may look “okay” for a few hours and mask the failure of the automatic system. That is why correlating to the start time is critical.
Independent verification: manual valve actuation (where possible), checking power/signal at the coil, verifying valve positions, and inspecting the main filter. If flow is present but soil does not respond, suspect a distribution problem (break, bypass, disconnected hose, an empty lateral). Decision: repair the sector first; do not compensate by increasing runtime on other sectors. Confirmation: in the next cycle, check that all points show similar responses and that the history no longer shows “phantom irrigations” with no effect.
7) Signature for overwatering: long plateau and weak aeration
Overwatering is often most visible between irrigations: moisture stays high for too long and the decline slope is small (the root zone does not re-aerate). In well-drained substrates, a high plateau can mean irrigation is too frequent; in heavier soils it may indicate slow infiltration and higher risk of root asphyxia. In sensitive crops (for example, tunnel vegetables or potted plants), excess water reduces root oxygenation and destabilizes uptake even when foliage does not show immediate symptoms.
Independent verification: check drainage (is there runoff? does water pond?), inspect valves for leakage after shutoff, and look for siphoning (elevation differences that keep pulling water after the system stops). If you also monitor EC, remember that the EC of the fertigation solution is not the same as EC in the root zone; excess water can temporarily dilute EC in drain/extract, but interpretation depends on method. Decision: adjust schedule based on the between-irrigation response and fix any hardware cause. Confirmation: over the next 24–48 hours (hypothetically), moisture should return to a clearer “irrigate–drain–consume” cycle.
8) Alert commissioning protocol: thresholds, delays, confirmation
Alert commissioning starts with a “learning week”: collect data under normal conditions, note real irrigation times, and establish typical signatures for each zone. Then define alerts on relationships, not only values: “irrigation detected but moisture does not rise,” “abnormally low flow during irrigation,” “moisture stays high too long after the last irrigation.” Add delays to avoid false alarms caused by soil inertia or infrequent reporting.
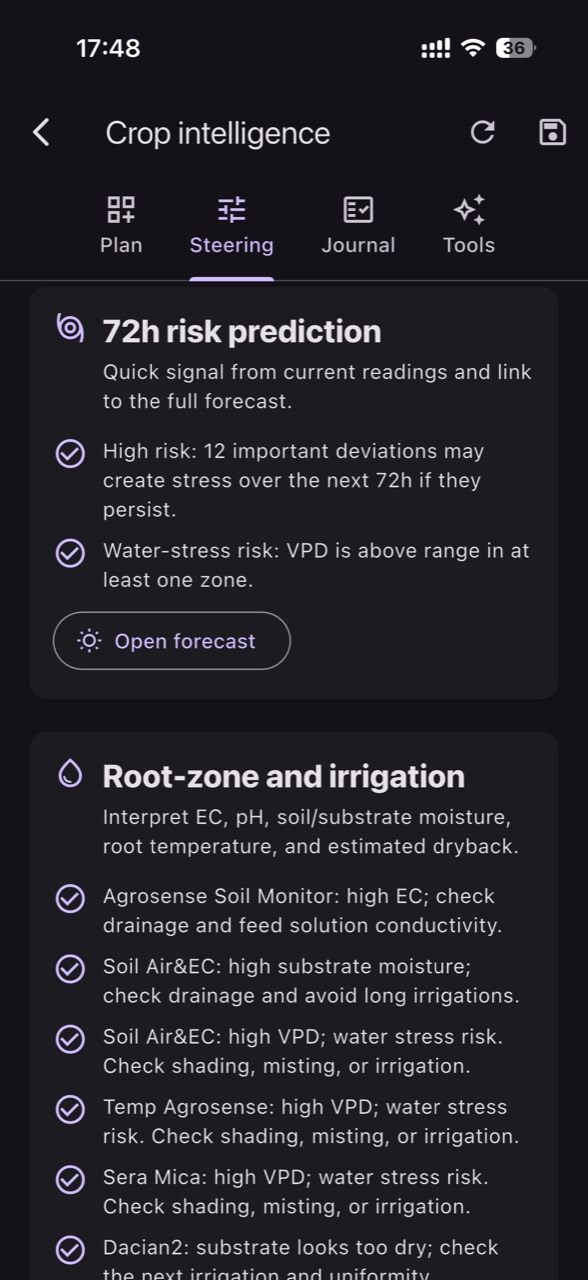
Each alert needs a response sheet: what you check first, what you measure independently, and what decision you take. A hypothetical example: for an “irrigation without response” alert, first verify data freshness and that the sensor is not “stuck”; then verify flow/valve status; only afterward suspect point clogs. In a platform such as GrowGuard you can set zone-based alerts and share them with the team, but the key is operational: after every intervention, run a confirmation test and review the history to ensure the problem signature has disappeared.
Conclusion
Fast detection of clogged drippers, non-irrigating sectors, and overwatering is not about a single sensor—it is about a protocol: a clearly identified irrigation event, fresh data, comparable measurement points, and simple independent checks. When you correlate flow/pressure with root-zone response, diagnosis becomes repeatable instead of intuitive.
Once alerts are commissioned and graph signatures are validated, interventions become quicker and safer, and schedule changes are made from evidence. If you want, you can use GrowGuard for zone monitoring and shared team alerts; start with one pilot sector, controlled tests, and a clear routine to confirm results after each fix.