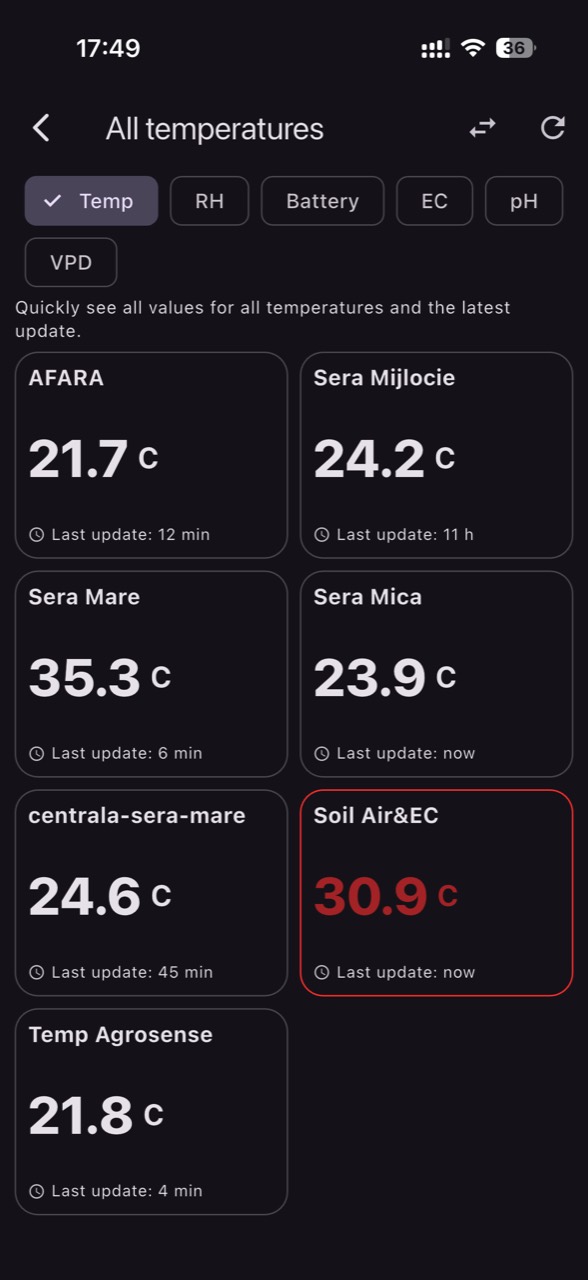
CO₂ can increase the rate of photosynthesis, but in greenhouses and tunnels there is no “CO₂ effect” separated from the rest of the climate. In practice, the same decisions that raise temperature or lower relative humidity (heating, ventilation, screens) also change VPD, and all three influence how much CO₂ the plant can actually use—not just how much CO₂ is in the air.
When you ventilate to control temperature or humidity, CO₂ is quickly diluted with outdoor air. If injection continues while you are pulling in fresh air, you can consume gas without getting a stable environment. Conversely, if you close everything to hold CO₂, you risk overheating, excessive VPD, or local condensation—physiological limits that can cancel the benefit.
Good control starts with correct measurement and a commissioning process that proves: the sensor reads reality, the data are fresh enough for decisions, and cause–effect links (ventilation → CO₂, heating → VPD, shading → temperature) are visible in history. Below is a practical workflow with independent checks and validation steps after any intervention.
1) Why CO₂ “doesn’t work” when temperature and VPD are in conflict
The mechanism is straightforward: CO₂ supports photosynthesis only when the plant has adequate light, leaf stomata are open, and the photosynthetic apparatus is not limited by heat stress. At overly high temperatures, respiration increases and efficiency drops; at overly high VPD, the plant closes stomata to reduce water loss, and CO₂ in the air no longer enters efficiently. You can have high ppm but low use.
What to observe: CO₂ stays high while temperature and VPD swing strongly; plants may look “tight” in hot hours (for some vegetables: leaf curling, slow growth, flower abortion). What to verify independently: a reference thermometer placed near the sensor and a spot-check of humidity with a handheld hygrometer. Practical decision: stabilize temperature/VPD before raising any CO₂ target. Result check: the next day, confirm smaller VPD/temperature swings and that CO₂ no longer drops abruptly during short ventilation events.
2) Ventilation: the main “consumer” of CO₂ and how to quantify it
Ventilation replaces indoor air with outdoor air, pulling CO₂ concentration back toward outdoor levels. In tunnels, the effect is often uneven: near sidewalls and doors dilution is rapid, while the center may remain higher. If you use screens or curtains, airflow paths can create pockets with different CO₂, and one sensor may not capture that variability, especially during partial openings.
What to observe: every vent opening produces a downward “step” on the CO₂ graph, sometimes followed by slow recovery. What to verify independently: the actual opening position and whether recirculation fans truly run (air movement, direction, unexpected stops). Practical decision: if you must ventilate, stop or reduce CO₂ injection during that window to avoid “injecting outdoors.” Result check: compare two hypothetical days with similar light; you should see shorter injection time without losing CO₂ stability when the structure is closed.
3) VPD: a useful indicator, but still an estimate (and leaves can be cooler)
VPD is calculated from air temperature and relative humidity, so it is an estimate of the air’s drying power on the leaf. The catch: the leaf is not always at the same temperature as the air. Under strong radiation, leaves can be warmer; under clear skies and cold air, leaves can be cooler—raising condensation risk even when air readings look “fine.” That is why VPD-based decisions should be validated in the crop.
What to observe: situations where calculated VPD seems acceptable, yet you see water on leaves or on plastic; or, conversely, VPD suggests “drying air” while plants still look wilted at noon. What to verify independently: systematic visual checks by zone (edges vs center) and, if available, a spot check of leaf temperature with an IR thermometer (hypothetical example, not mandatory). Practical decision: use VPD as a signal for ventilation/heating/shading, but confirm with transpiration and condensation observations. Verification: after changes, look for less morning condensation and a smoother VPD curve through peak hours.
4) Temperature: when you control CO₂, you also control plant “capacity”
In protected cropping, temperature is the metabolism accelerator, and CO₂ becomes effective only when light and temperature allow net photosynthesis. If you raise temperature to avoid very low VPD or condensation, you also raise plant water demand; if you then ventilate aggressively to cool down, you lose CO₂. Additionally, temperature distribution can differ between the upper volume (near the roof) and the canopy level where the biological decision happens.
What to observe: CO₂ appears stable, but production signals (set quality, stem thickness) do not respond; or you see developmental differences across rows. What to verify independently: temperature at the growing tip and at fruit level (two points), plus an airflow check from heaters/vents. Practical decision: adjust temperature uniformity first (recirculation, directing air jets), then optimize CO₂. Result check: confirm zone-to-zone differences shrink in temperature history and that CO₂ no longer shows large swings tied to heating versus airing moments.
5) Choosing a CO₂ sensor and installation traps (what compromises data)
For commissioning, what matters is knowing what you measure and where: CO₂ is usually reported in ppm, and for control you need a stable sensor with low drift and response fast enough to capture ventilation events. Poor installation is more common than a “bad sensor”: mounting too close to doors, vents, burners, heater jets, or in direct sun can produce values that reflect local currents rather than the crop zone.
What to observe: irregular spikes, values that jump when heating starts or a door opens, or a consistent offset versus a portable instrument. What to verify independently: a spot comparison with a second instrument (even borrowed) to confirm the order of magnitude, and a placement check at canopy height in a representative area. Practical decision: relocate the sensor to a central point protected from direct airflow, then allow readings to stabilize. Verification: after relocation, the CO₂ curve should look more “physical”—down with ventilation, up with injection, without unexplained jumps.
6) Commissioning workflow: from “I read ppm” to operable control
Step 1: confirm data freshness (reporting interval) and that units are correct (ppm) and time is correct (time zone). Step 2: run one “observation day” without major changes: manually note when you ventilate, when heating starts, and when shading is applied. Step 3: check whether those signals leave fingerprints in the graphs: ventilation should imprint on CO₂ and on temperature/RH; if not, either the sensor is poorly placed or the event wasn’t real in the crop zone.
Step 4: run two short, controlled hypothetical scenarios: (A) 10–15 minutes of recirculation without ventilation, (B) a short ventilation window. You are not chasing “targets,” but responses: how fast CO₂ drops with ventilation and how fast it rebounds after closing. Practical decision: define an operating rule—inject CO₂ in windows when ventilation is minimal and recirculation is active. Verification: in the following days, you should see longer stable CO₂ periods and fewer rapid injection–loss alternations.
7) Daily decision protocol: CO₂ as part of the “climate–water balance”
In the morning, the goal is to start photosynthesis without creating condensation. If air is cold and humid, a short heat input can lift air temperature and VPD, but may require controlled ventilation to remove excess moisture; that ventilation will lower CO₂. The mechanism to manage is intervention order: dehumidify (heat plus controlled airing) before investing in CO₂, so stomata are not blocked by wetness/condensation conditions.
At midday, as radiation rises, temperature and VPD can climb quickly. What to observe: if VPD rises and plants reduce transpiration, CO₂ can remain artificially high (not being consumed), which may mislead you into thinking “it’s working.” What to verify independently: visual turgor checks and the temperature at the growing tip zone. Practical decision: if forced to choose, prioritize reducing heat stress (shading, ventilation) even if CO₂ drops, then resume injection when climate is stable. Verification: next day, confirm fewer midday wilting episodes and a CO₂ curve that follows use (a gentle decline during active photosynthesis rather than flat high readings).
8) Monitoring and alerts: thresholds, errors, and post-change validation
Useful thresholds are not “universal numbers,” but triggers for a check. For CO₂, a sudden drop alert may indicate a vent left open or a forgotten door; an unexpected rise may point to a local source (for example, combustion) or a sensor sitting in an air jet. For VPD and temperature, alerts must be linked: reacting to CO₂ alerts without climate context leads to the wrong action at the wrong time.
What to observe and validate: after any adjustment (vent schedule, screens, recirculation), compare two similar windows from different days, not a single moment. Check whether the change reduced oscillation amplitude and improved CO₂ recovery time after closure. Practical decision: set alerts by zones, not only “the greenhouse,” because the tunnel edge can behave differently than the center. In GrowGuard you can follow zone history and build a routine to verify performance after each major intervention. Verification: if alerts decrease and graphs become predictable, control is more commissionable; if you get many “false alarms,” revisit sensor placement and confirm what actually happened on site.
Conclusion
CO₂ control becomes effective when you treat it as part of the same system as ventilation, VPD and temperature. The core mechanism is plant uptake, not air concentration alone: stomatal behavior, heat stress and condensation risk can limit response, while ventilation can quickly erase injection. That is why commissioning requires independent checks and comparisons across similar windows—not a single “good value” at one time.
To operationalize decisions, build a short workflow: confirm data freshness, confirm the response to ventilation/heating, define injection rules for stable windows, and validate changes in history. For zone-based monitoring and alerts, GrowGuard can help you correlate CO₂ with temperature and VPD so the team reacts consistently—contact us if you want help setting up a practical commissioning routine.