In corn, irrigation decisions are often made in a short window: the crop can enter stress quickly, yet an irrigation triggered in the wrong place—or based on a misleading reading—can waste water and increase unevenness. That is why soil sensors only help when points are representative and the data is interpreted by zones, not as a single average.
Drought in field crops is not only “lack of rain”. It is a mix of high evaporation, different water reserves through the profile, roots limited by compaction, and heat waves that raise atmospheric demand. In corn, those effects show up differently on ridges, in depressions, along forest edges, or in blocks with contrasting soil textures.
This article is a diagnostic guide: how to tell true stress from false readings, a placement problem from an irrigation problem, and how to compare microclimates to choose irrigation order and timing. For each situation you get the mechanism, what to observe in the field, what to verify independently, a practical decision, and how to confirm the result.
1) Corn and the “active zone”: why depth matters more than a percentage
Corn adjusts water use by growth stage and by how much water it can extract from the root zone. In sensitive periods (for example, before and during tasseling and silking), a fast deficit in the soil layer explored by roots can reduce growth and uniformity. The catch: a sensor installed too shallow can flag “dramatic drought” even though deeper layers still hold usable reserve.
Field confirmation starts with a physical check: dig or use a soil probe to see where roots actually stop and whether there is a compacted or extremely dry layer. Also check how readings change after a short rain: do they rise only near the surface and then drop quickly? Practical decision: prioritize irrigation when moisture declines in the active zone, not when only the surface dries. Result check: after irrigation, track the response by depth (wetting front) and look for improved vigor uniformity along rows.
2) Choosing points: representative does not mean “the most convenient place”
Sensor placement in corn should reflect your main soil types and historical risk areas: sandy/loess zones, heavy clay zones, irrigation end-guns or edges, wind-exposed ridges, shaded corners. A sensor installed next to a road, a ditch, or a heavily trafficked access strip can produce readings that do not match the rest of the block. Likewise, placing a sensor in a “nice-looking” greener patch can delay a needed irrigation.
A practical protocol is to define 2–4 crop zones from soil maps, relief variation, and what you observed in previous dry years. Then choose one installation point per zone inside the block, away from edges and run-on/runoff strips. Decision: don’t irrigate “by the farm average”; irrigate based on the zone that enters stress first when that zone is relevant in area or strategic importance. Verification: compare how zones evolve after irrigation, not just the number from a single sensor.
3) Installing so you don’t “measure air”: contact, orientation, and soil disturbance
A common cause of false alarms is installation that leaves air gaps around the probe or places it into loose, disturbed soil left by digging. In that case the sensor can overreact to local drying or heating, and the moisture curve looks “nervous”. In corn fields, machinery vibration and clay shrink–swell can worsen this—especially with shallow installation—by gradually loosening contact or creating micro-voids.
Independent verification: compare the sensor curve after rainfall/irrigation with what you see in a soil section. If the sensor shows “wet” but the soil near roots remains dusty, you may have created preferential flow along the probe. Decision: reinstall in a better point or redo the installation to restore tight soil contact while preserving the natural soil structure as much as possible. Confirmation: the curve becomes more “logical”—rising after irrigation, then declining gradually—without unexplained jumps or suspicious flat plateaus.
4) Microclimates within the same block: wind, shade, slope, and soil temperature
Two zones only 200 meters apart can have different water use: a wind-exposed ridge dries faster, a depression may store more water but warms differently, and along shelterbelts evapotranspiration drops while water competition can increase. Soil temperature influences root activity and drying speed; however, do not confuse temperature with salinity: EC and pH require dedicated probes and a clearly defined sampling/extraction method.
What to observe: temporary midday wilting in exposed areas, earlier leaf rolling, differences in height and color. What to verify: compare soil-temperature sensors between zones, do visual scoring at the same time of day, and consider the forecast for upcoming heat waves. Decision: sequence irrigation by zones (often prioritizing ridge/wind zones) rather than rotating “evenly” across the whole block. Result check: within 24–48 hours, midday stress differences should narrow in the zone you prioritized.
5) Misleading data: units, freshness, and transmission “jumps”
Before drawing agronomic conclusions, verify whether the issue is data quality. Some sensors report volumetric water content (VWC), others report tension (kPa), and you cannot swap interpretations without calibration and soil-texture context. Data freshness also matters: a reading that is a few hours old on a hot, windy day may describe a condition that has already changed. Sudden steps can come from device restarts, temporary signal loss, or low battery.
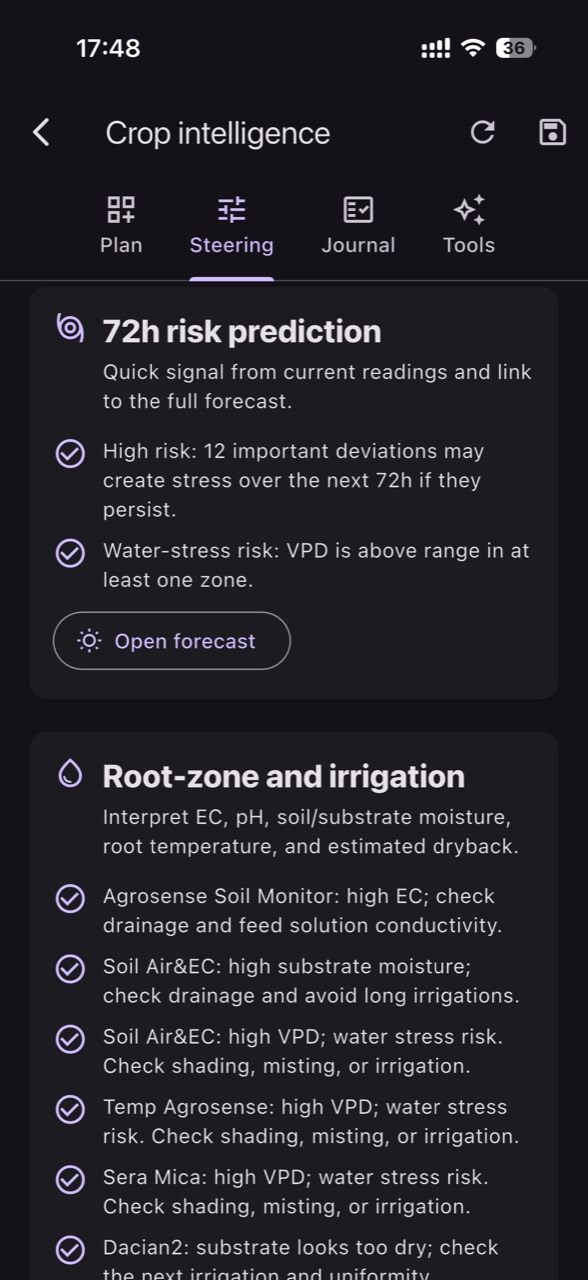
What to verify independently: consistency with a quick manual control (probe/dig check, soil feel and structure, visible crop symptoms) and correlation with events (rain, irrigation, machinery passes). Decision: don’t trigger irrigation from a single alarm spike; require confirmation across two reporting cycles and, ideally, two depths. In GrowGuard you can set alerts by zone and also watch device/battery status so you can separate real stress from an unreliable data stream. Confirmation: once data issues are solved, curves should align better with what you observe in the field.
6) When irrigation seems “fine” but the sensor doesn’t move: wetting front and uniformity
If you irrigated and the sensor shows no increase, three main mechanisms are likely: water did not reach that point (an unwatered sector, pressure/nozzle issue), it reached the area but bypassed the measured zone (preferential infiltration, cracks, compaction), or the probe sits outside the wetted pattern (for example too far from a drip line, or at a depth the wetting front never reaches). In corn, roots can explore deep, yet irrigation may wet only the surface layer if run time is too short.
Recommended direct checks: do a quick uniformity test using catch containers (“catch-cans”) or improvised rain gauges placed along a transect, to see whether sprinkler/applied water is even across width and length; and check pressure/nozzles where accessible. Decision: adjust run time or sectoring so the wetting front reaches the active root zone rather than only “cooling” the surface. Confirmation: after the next irrigation, you should see a rise at the relevant depth and reduced contrast between the catch-container measurements across the field.
7) True drought stress vs. something else: compaction, salts, nutrition, and limited roots
Corn can show drought-like symptoms even when the problem is not water amount, but access to it. A compacted layer or tillage pan can limit rooting, so the plant enters stress although a shallow sensor still shows acceptable moisture. In other cases, high salinity reduces water availability to the plant (osmotic stress). Note: EC does not identify individual nutrients, and it must be measured in the correct medium (water, fertigation solution, soil extract/substrate extract) using a dedicated probe; a temperature sensor does not measure EC or pH.
What to observe: smaller plants in repeating bands, roots bending or flattening at a hard layer, stress patches that mirror machinery traffic lanes, or wilting that is out of proportion to measured moisture. What to verify: a soil profile inspection and signs of compaction (at least by digging), and if salinity is suspected, an EC measurement or analysis done with a consistent method and interpreted separately from moisture. Decision: don’t mechanically compensate with more water if roots are blocked; prioritize agronomic correction (decompaction in rotation, controlled traffic) and adjust irrigation by zones. Confirmation: over time, recurring bands fade and the “soil water – plant response” relationship becomes more coherent.
8) Closing the loop: local thresholds, zone comparisons, and post-decision validation
A strong monitoring system is not about universal thresholds; it is about locally built thresholds for your texture, rooting depth, irrigation system, and production objective. In corn, zone differences are often clearer in trends than in a single number. That is why you compare zones (ridge vs. depression, sand vs. clay) and watch the rate of drying after irrigation—not only “what it is right now”.
A post-decision verification protocol: record irrigation time, duration, and sector, then check over the next 6–24 hours whether the expected response appears by depth and whether midday visual stress decreases. If not, return to diagnosis: uniformity, installation, data integrity, or root limitations. A platform such as GrowGuard helps with zone visualization, history, and alerts, but the decision remains an agronomic one validated in the field. Final confirmation is consistency: the same intervention produces the same response in comparable zones.
Conclusion
Soil sensors can be extremely valuable in corn, but only if you treat them as diagnostic instruments—not an oracle. Place them in representative zones, verify installation quality and data freshness, compare microclimates within the same block, and always confirm with independent field observations. This is how you separate real stress from reading errors and prioritize water where the crop enters risk first.
When the loop is complete—correct installation, well-chosen zones, uniformity checks, and post-irrigation validation—your decisions become repeatable and explainable. If you want, you can use GrowGuard to apply the same principles on a map, with zone-based alerts and forecast context, so the team works from the same references and spends less time chasing “false alarms”.