In corn production, drought rarely means “no water” everywhere in the same way. The same rainfall can refill the profile in a clay zone and pass with little effect through a sandy or compacted zone. That is why good irrigation decisions start with understanding the soil water reservoir and how roots can access it at each growth stage.
Soil sensors can turn that invisible reservoir into data: when water is being depleted, how deep the drying front moves, what happens after an irrigation event, and how quickly stress returns. But sensors are not “absolute truth”: the measurement type, placement, depth, and independent checks make the difference between a nice-looking chart and a correct decision.
This article explains the mechanism of water stress in corn, what to watch in the data, what to verify separately in the field, and a practical commissioning workflow: sensor selection, installation, validation, local thresholds, and post-irrigation result control. It does not propose a fixed irrigation template, but steps you can adapt to your soil, zoning, and irrigation system.
1) Why corn reacts differently to drought depending on growth stage
Corn is sensitive to water stress at several moments, but the impact depends on which physiological process is limited. In early vegetative growth, deficit reduces growth and can delay canopy closure, increasing soil evaporation. Near flowering, lack of water and heat can reduce pollen viability and disrupt the synchrony between tassel and silks, with a large impact on kernel number.
What to observe: rapid soil-moisture decline in the active root layer, high soil temperatures, and episodes of high evaporative demand (wind, high temperatures). What to verify independently: leaf appearance in the morning versus afternoon, rooting depth (a simple profile check), and uniformity across micro-zones. Practical decision: prioritize irrigation for the zones that enter stress first, especially before sensitive stages. Check the result via the moisture response at the target depth and reduced symptoms within 24–48 hours (hypothetical example).
2) What “soil moisture” sensors really measure and why units matter
Common field sensors measure either volumetric water content (VWC) or tension/matric potential (how hard the plant must work to extract water). VWC is intuitive for a water balance (it rises after rain/irrigation), but the relationship to “plant-available water” depends on soil texture and bulk density. Matric potential relates more directly to root effort, but it requires careful interpretation by soil type and correct installation for good soil contact.
What to observe: signal stability, jumps after rainfall/irrigation, and the difference between depths. What to verify: a texture estimate and a basic structure/compaction assessment (probe, spade). Practical decision: choose the unit and sensor type that fit how you manage irrigation (profile water balance versus “how tightly the soil holds water”). Check the result by consistency between data and field observations: if a sensor reads “wet” while soil at that depth is dusty, installation or sensor choice may be the real issue.
3) Choosing sensors: moisture, temperature, and what not to mix up
For drought management in corn, the minimum useful setup is soil moisture plus soil temperature, ideally at 2–3 depths relevant to the root zone. Soil temperature helps interpret depletion (evaporation, root activity) and separate situations: a hot, dry soil can accelerate stress even if moisture looks “still acceptable.” Connectivity such as NB-IoT or LoRaWAN can fit large blocks where mains power is unavailable and you need remote data.
What to observe: if you need daily decisions, track data freshness (transmission interval) and latency; a sensor that reports infrequently can miss the consumption peak during a heat wave. What to verify: don’t confuse parameters—a temperature sensor does not measure EC/pH, and EC does not identify individual nutrients. If you monitor EC, state the medium and method: irrigation water, fertigation solution, a soil extract, or an in-soil measurement. Practical decision: start with moisture + temperature and add other parameters only when you have a clear agronomic question.
4) Field zoning: where to place sensors so the average doesn’t mislead you
The most common mistake in field crops is deciding “from the farm average”: a sensor installed by the road in the most convenient location will miss the zone that enters stress first. In corn, differences in texture, effective depth, and compaction can create micro-zones with fast depletion. Practical zoning starts from yield history, burn patches, soil maps (if available), and post-rain observations: where water ponds and where it dries immediately.
What to observe: contrasts after precipitation (infiltration), vigor variability, and differences in growth stage. What to verify: 2–3 confirmation pits (profiles) at candidate points to confirm tilled depth, compact layers, and texture. Practical decision: install sensors at representative points for each critical zone (hypothetical example: a sandy ridge area and a heavier lowland area). Check the result by seeing the “critical zone” show the first declines and trigger decisions earlier than the rest of the field.
5) Commissioning: an installation and validation protocol for the first 7–10 days
A robust commissioning workflow has simple steps: (1) record coordinates and a point description (soil, relief, crop, growth stage); (2) install at depths so at least one sensor sits in the active root layer and one deeper sensor shows whether water penetrates below; (3) ensure good soil contact (no air gaps), correct orientation, and mechanical protection from field operations. Then track 2–3 events: a rain, an irrigation, and an interval of intense crop use.
What to observe: the time response—the curve should rise after rain/irrigation and gradually decline between events. What to verify independently: at least once, do a simple gravimetric check (soil sample weighed before/after drying) or a tactile assessment at sensor depth; not for “perfect calibration,” but to confirm the value makes physical sense. Practical decision: if the response is delayed, too small, or unstable, correct installation before setting thresholds. Result: coherent 7–10 day data without unexplained “jumps.”
6) Interpreting drought: chart signatures and field checks
In corn, drought appears in the data as a continuous decline in the upper layer followed by decline at deeper layers—a “drying front” moving downward. If you irrigate shallowly, you’ll see increases only near the surface and little or none deeper; if irrigation is effective, multiple depths respond with different amplitudes. Soil temperature may rise at the same time, accelerating evaporation and reducing root-zone comfort even before visible symptoms.
What to observe: the rate of decline (how fast the crop is using water), differences between zones, and whether irrigation “recharges” the profile or only moistens the surface. What to verify: infiltration (crusting, ponding), losses through runoff, and irrigation system uniformity (pressure, nozzles, clogging). Practical decision: choose between longer/less frequent versus shorter/more frequent irrigations based on how water moves in your profile, not a fixed schedule. Check the result by comparing curves before/after the change and by field inspections (hypothetical example: fewer very sharp “teeth” in the top layer).
7) Setting local thresholds and alerts without “false alarms”
In field conditions, useful thresholds are not universal: they depend on the sensor, soil, depth, hybrid, plant density, and growth stage. A practical method is to define thresholds from your own history: identify periods when the crop performed well (vigor, no symptoms) and note the value range; then compare with periods when first stress signs appeared. Alerts should be tied to an action: “if it drops below X in the critical zone, I do field check Y and decide on irrigation.”
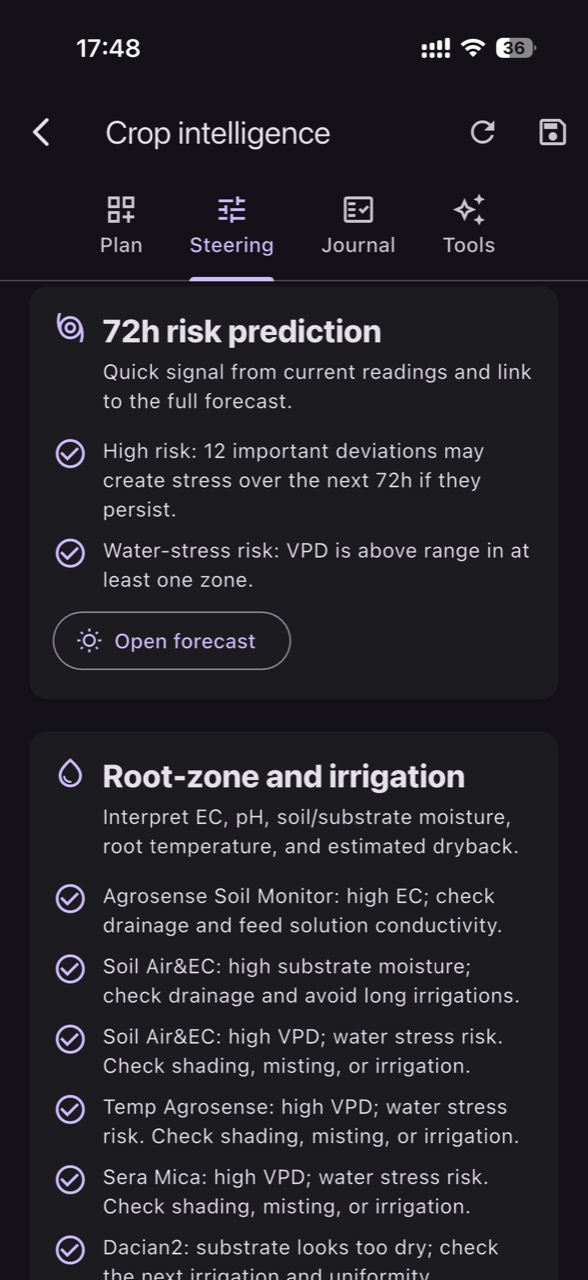
What to observe: repeated alerts with no field consequence usually mean a poor threshold or a non-representative point. What to verify: cross-check with forecast and evaporative demand; a “borderline” value before a heat wave may justify preventive irrigation, while the same value ahead of likely rain may justify waiting and re-checking forecast. Practical decision: set different thresholds by zone and depth, not one threshold for the whole field. In GrowGuard, soil moisture/temperature alerts plus forecast context can help you prioritize intervention.
8) After irrigation: how to prove the decision was good (or not)
Every irrigation should be followed by a result check—otherwise you learn nothing about your soil and system. In the data, look for three things: (1) the amplitude of the increase at the target depth; (2) how long the higher level persists; (3) whether the deeper layer responds, indicating useful percolation or, conversely, losses. In corn, an irrigation that only lifts the surface layer can create a short-lived effect, with stress returning quickly during heat waves.
What to observe: differences between zones after the same irrigation—if one zone recharges poorly, it may have low infiltration, compaction, or uneven water distribution. What to verify: inspect soil 12–24 hours after irrigation (wetting depth), check uniformity along the irrigation line, and look for excess signs (ponding, anaerobic smell in pits). Practical decision: adjust duration, flow, or zone sequencing and document what you changed. In GrowGuard, history and zone comparison help connect the intervention to the response without confusing rainfall effects with irrigation.
Conclusion
Soil sensors become truly useful in corn only when they’re installed in representative zones, validated in the first days, and interpreted together with growth stage, soil texture, and forecast. The key is to turn every irrigation into a “controlled test”: observe the curve, verify in the field, adjust, and confirm at the next event. This reduces intuition-only decisions and avoids irrigating based on an average that hides critical zones.
If you want to organize these readings by zones and receive alerts when one zone is the first to enter stress, you can use GrowGuard as a monitoring and history platform; start with a simple commissioning protocol and expand the sensor network gradually as your agronomic questions become clearer.