In greenhouses and tunnels, cucumbers grow quickly, build a dense canopy, and can change water use from one day to the next. That is why VPD (vapor pressure deficit) becomes a useful indicator: it tells you how strongly the atmosphere is pulling water from leaves. When VPD is unsuitable, stress or condensation can appear fast, even when the root zone seems fine.
High humidity is not only a problem because of its numeric value, but because of how long leaves stay wet and how little air movement there is. In a “closed” tunnel, small differences between air temperature and colder surfaces (film, structure, leaves) can trigger condensation. Long periods of leaf wetness increase foliar disease pressure, and symptoms show up after many conducive hours have already accumulated.
A good monitoring system does not replace crop walking; it makes it faster and more precise. You can see when risk formed, in which zone, and for how long. This article covers the fundamentals of VPD in cucumbers, what is worth measuring with sensors, and a practical commissioning workflow: choosing units, placement, alert logic, and checking results after you intervene.
1) What VPD tells you in cucumbers—and what it does not
VPD is an estimate calculated from air temperature and relative humidity that indicates the evaporative demand on the leaf. In cucumbers, excessively high VPD increases transpiration and can quickly lead to water deficit, temporary midday wilting, and growth interruptions—especially once the canopy is large. Excessively low VPD means near-saturated air: weak transpiration, less evaporative cooling, and conditions that make condensation easier to form.
What to observe: soft leaves during hot hours, sensitive growing tips, and differences between rows or areas near doors. What to verify independently: root-zone condition (by hand feel or a soil/substrate moisture sensor), drip irrigation function, and whether cold drafts occur at night. The practical decision links to ventilation/heating/shading, not “chasing a number.” Check the result by comparing VPD and the duration of humid periods before and after the change, and by looking for improved plant uniformity.
2) Humidity, condensation, and “leaf wetness”: the real mechanism behind disease risk
Foliar problems such as downy mildew, powdery mildew, and other leaf diseases are strongly influenced by microclimate. High humidity and prolonged leaf wetness do not confirm that a pathogen is present, but they do show that conditions are favorable. Condensation often forms early morning or evening when warm, moist air meets cooler surfaces; in dense crops, air stagnates between leaves and drying takes longer. In cucumbers, canopy density makes these humid “pockets” hard to guess without zone-level measurements.
What to observe: droplets on leaves, a thin water film, a “stuffy” smell, and areas that visibly dry more slowly. What to verify independently: possible inoculum sources (plant debris, planting material, irrigation water) and overall hygiene, because microclimate only indicates conducive conditions—not the cause. Practical decision: reduce leaf-wetness duration through air exchange and thermal management (for example, avoiding abrupt cooling). Check the result by tracking fewer hours at very high humidity and seeing less morning condensation during inspections.
3) Microclimate differences inside one tunnel: why a single station is not enough
In protected structures, microclimate can change over short distances: near entrances, at end bays, under the ridge, close to screens, inside dense canopy zones, or near heating sources. Cucumbers amplify these differences because evapotranspiration rises quickly as leaf cover closes. One “middle-of-house” reading can look acceptable while edges run cooler, stay wetter, and accumulate many hours of leaf wetness.
What to observe: repeated hotspots in the same corners, plants that look “darker” (wetter leaves), and uneven growth. What to verify independently: whether vents actually open as intended, whether airflow is blocked (loose film, curtains), and what surface temperatures are doing in the morning. Practical decision: split the crop into monitoring zones and manage openings/ventilation with those differences in mind. Check the result by looking for reduced zone-to-zone gaps in temperature/RH/VPD and shorter very-high-humidity intervals in the problem area.
4) Choosing sensors: what you measure for VPD versus what you measure at the root zone
For VPD you need air temperature and relative humidity measured correctly at canopy level, shielded from direct radiation and away from air jets. VPD derived from these values remains an estimate: leaf temperature can differ from air temperature, especially on sunny days or when transpiration changes abruptly. In parallel, cucumbers require steady water; a soil/substrate moisture sensor helps separate “high VPD demand” from “insufficient water at the roots.”
What to observe: whether VPD peaks coincide with drops in root-zone moisture, and whether humid-air episodes coincide with overly wet substrate (risk of hypoxia). What to verify independently: actual dripper flow, uniformity by row, and potential clogging. Practical decision: choose dedicated tools for each medium; a temperature sensor does not measure EC or pH, and EC/pH require separate probes used in water/solution or in an extract depending on method. Check the result by ensuring data varies realistically and aligns with events (venting, irrigation, cooling).
5) Commissioning the measurements: placement, units, data freshness, and common errors
Commissioning means proving your data is credible before you act on it. For air sensors, confirm they are shaded and positioned in a representative canopy zone—not against plastic film, metal, or next to doors. For soil/substrate sensors, depth and distance from the dripper matter: too close gives exaggerated “spikes,” too far shows drought that may not represent the plant. Record units (°C, %RH, kPa for VPD) and the transmission interval; data that is too infrequent can miss short condensation windows.
What to observe in the first 3–7 days: “flat-lined” values (for example, constant humidity), abrupt jumps that do not match reality, and two nearby points reading wildly different without a physical reason. What to verify independently: a spot-check with a handheld thermometer/hygrometer and a physical inspection of placement. Practical decision: adjust placement before setting strict alerts. Check the result by confirming curves become consistent with tunnel events and that zone differences make sense (entrances, ends, dense canopy).
6) Daily workflow: linking VPD to ventilation and to water management
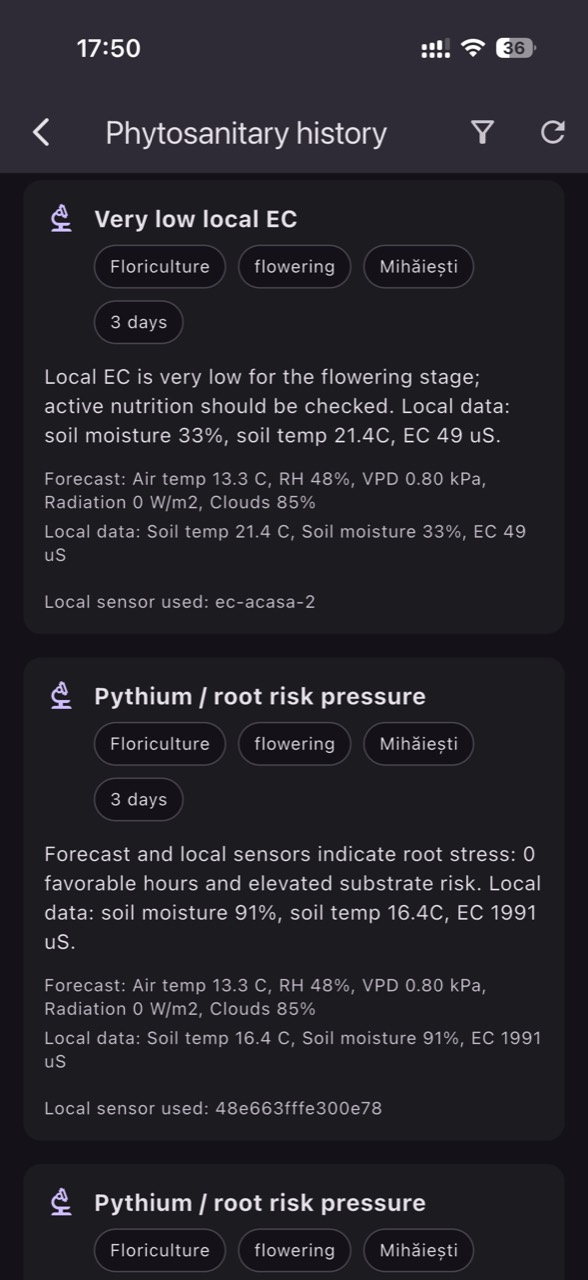
A useful workflow starts with operational questions: when do excessive-humidity periods occur, when does VPD rise sharply, and which zones are affected first. In the morning, watch the night-to-day transition where condensation commonly occurs. At midday, watch VPD peaks, especially on clear days when leaves can transpire heavily. In the evening, watch how quickly humidity returns and whether the structure stays “closed” for too long. In GrowGuard, these patterns can be reviewed by history and by zone without assuming all rows behave the same.
What to observe: overlap between high-VPD periods and fast root-zone moisture decline, and between low VPD and leaf-wetness episodes. What to verify independently: whether microclimate changes coincide with real actions (vent opening, heating starting, irrigation events). Practical decision: when VPD rises, the priority is avoiding stress through the right mix of ventilation/shading and root-zone water—without turning the space into a “sauna” with excessive humidity. Check the result by expecting fewer extreme episodes the next day and a more uniform crop at the tip.
7) Risk alerts: local thresholds, duration, and validation without “false alarms”
Good alerts are not only about a value, but about combination and duration. For foliar disease pressure, the time spent at high humidity and whether leaves stay wet matter; for stress, how long VPD remains high matters. Instead of copying universal thresholds, establish local ones: start with “observation” alerts and adjust after 1–2 weeks of data plus crop walks. If you use a leaf-wetness sensor, treat it as practical confirmation of condensation, not as a disease diagnosis.
What to observe: how many alerts occur per week, at what times, and whether they match what you see in the tunnel. What to verify independently: when you get a high-humidity alert, enter and look for condensation signs; when you get a high-VPD alert, quickly check plants and substrate. Practical decision: tune thresholds using time windows (for example, alert only if the condition persists) to avoid reacting to 5-minute swings. Check the result by seeing fewer but more relevant alerts and clear reductions in the duration of risk after interventions.
8) After an intervention: confirming you reduced risk and what traps remain
Microclimate interventions can have side effects: venting reduces humidity but may drop temperature and create condensation if cooling is too abrupt; heating can dry air but raises VPD and may induce stress if root-zone water cannot keep up. That is why verification must be two-sided: climate (temperature, RH, VPD) and root zone (soil/substrate moisture). Also remember that pathogen sources can persist in plant debris, planting material, or irrigation water; microclimate only shows how favorable the environment is.
What to observe: after a strategy change, track over 2–3 days whether very-high-humidity hours decrease, morning condensation fades, and VPD peaks become more controlled. What to verify independently: leaf scouting in historically problematic zones and irrigation-system checks for uniformity. Practical decision: if certain corners remain risky, address the physical cause (poor circulation, leaks, temperature gradients) rather than simply raising thresholds to silence alerts. Check the result by seeing smaller zone differences and shorter, rarer leaf-wetness episodes.
Conclusion
With cucumbers, controlling VPD and humidity is not about hitting a fixed number; it is about reducing extremes and shortening the time leaves stay wet. Success comes from understanding the mechanism (transpiration versus condensation), measuring by zones, and doing independent checks: crop inspection, irrigation uniformity, substrate condition, and potential inoculum sources.
If you want a repeatable workflow, start with correct sensor commissioning, follow daily patterns, and set duration-based alerts rather than impulse alerts. A monitoring platform such as GrowGuard can help you see zone differences, keep history, and react faster; then you confirm in the tunnel that your actions reduced condensation and stabilized the crop. If you want, use this article as a checklist for your next commissioning round.