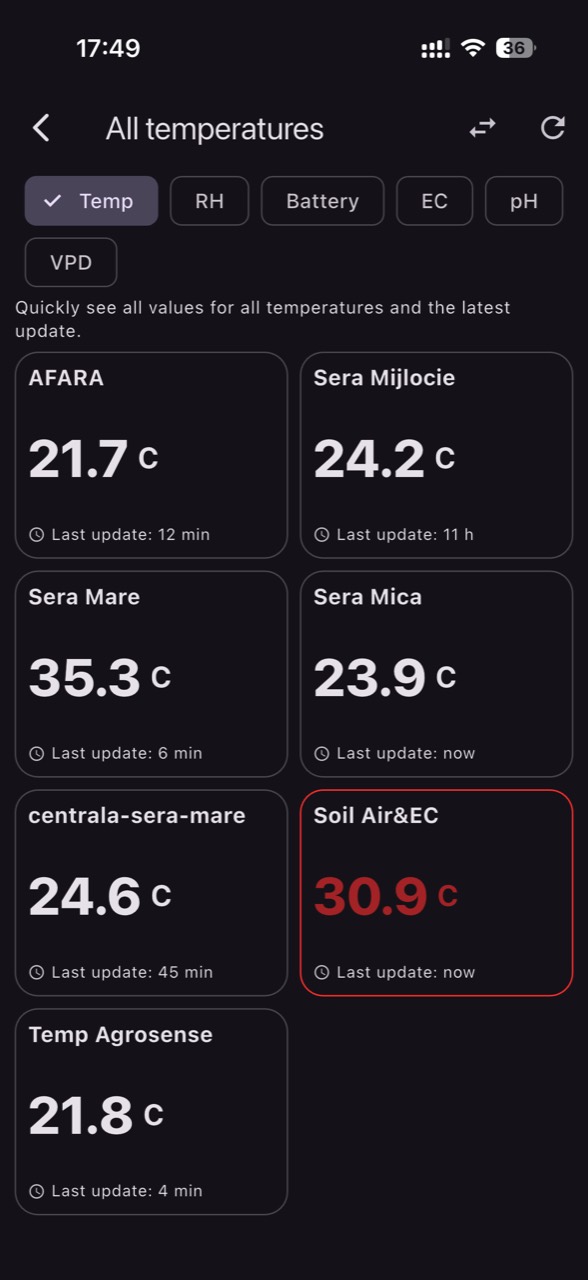
In cut-flower greenhouses, small differences in temperature, humidity, and air movement can break batch uniformity: uneven stems, shifted flowering, weaker heads, or greater sensitivity during handling and transport. That is why many growers watch VPD as a quick indicator of plant “comfort.” But VPD is only as good as the measurements behind it.
The practical problem starts when the reading looks alarming and the crop does not confirm it (or the other way around). A sensor near a door, above an aisle, beside a heating outlet, or under a fan can report a VPD that does not describe the plant mass. In floriculture, where canopy density and condensation matter, one measurement point can drive interventions that harm rather than help.
This article is a diagnostic guide: how to divide your space into crop zones, how to choose and place sensors (air and root-zone/substrate), how to compare microclimates, and how to verify independently whether you have a real irrigation, ventilation, or heating problem—or just a misleading reading. The examples are hypothetical and follow a protocol, not universal “recipes.”
1) VPD in cut flowers: what it tells you, what it doesn’t, and why it can mislead
VPD is an estimate of the air’s evaporative demand, calculated from air temperature and relative humidity. In cut flowers, that demand influences transpiration, calcium flow, and stem growth rate, but it does not directly “measure” leaf status. Leaf temperature can differ from air temperature (radiation, drafts, shading), and VPD does not automatically capture root-zone stress or substrate conductivity constraints that restrict uptake.
What to observe: slightly curled leaves, dry margins, thinner stems—or at the opposite extreme, heavy leaves and higher Botrytis risk inside a dense canopy. What to verify independently: a handheld IR thermometer for a leaf–air difference (indicative), early-morning condensation, airflow within the canopy, and consistency of substrate moisture. Practical decision: before changing ventilation/shading/irrigation, compare VPD from two points at the same height. Check the result by looking for reduced zone-to-zone differences, not simply a number that “looks right.”
2) Mapping microclimates: define crop zones before you move sensors
In a cut-flower greenhouse, real zones come from physics and workflow: near sidewalls and gable ends, under thermal screens, along ventilation paths, by doors, along main aisles, under lighting fixtures, at the end of a heating loop, or where plant density differs. Benches, beds, and rows can form “air barriers,” and hanging baskets can shade and redirect air currents beneath them.
What to observe: stem height differences within the same variety, faster substrate dry-down on one strip of benches, or condensation appearing only in specific corners. What to verify independently: a five-minute daily walk with notes on a sketch (where it smells damp, where it feels hot, where drafts are strongest). Practical decision: define 3–6 stable zones (not “every bench”), then allocate at least one air sensor per key zone. Check the result: if zones show similar trends (rise/fall in sync), zoning is reasonable; if not, the zone is too large or the sensor is poorly positioned.
3) Air-sensor placement: height, shielding, and distance from disturbance sources
For cut flowers, an air temperature/humidity sensor should represent the air “experienced” by the crop mass, not ceiling air or a local stream. Placing it at canopy height—and adjusting as the crop grows—matters more than mounting it where it is convenient. The sensor should be protected from direct radiation (sun, fixtures) and from dripping/mist; otherwise humidity can be overestimated and calculated VPD becomes artificially low.
What to observe when placement is wrong: abrupt jumps when a fan starts, consistently warmer readings near a pipe, or humidity that “sticks high” after a mist event. What to verify independently: compare with a portable instrument held 2–3 minutes near leaves at the same point; if the difference persists, it is not just response time. Practical decision: move the sensor 1–2 meters away from doors, heaters, vents, and fans while keeping good air circulation around it. Check the result: short spikes should reduce, and nighttime curves should become smoother and better aligned with real ventilation behavior.
4) When the reading is correct but the plants “don’t show it”: leaf–air differences and canopy microclimate
In dense houses, the microclimate inside the leaf mass can be much more humid and cooler than aisle air. A neatly mounted sensor at the edge can show moderate VPD while leaves inside sit near saturation for hours, supporting foliar disease and Botrytis. Conversely, a sensor in a draft may report high VPD, while a shaded, cool leaf transpires less than the calculation implies.
What to observe: wet leaves in the row interior in the morning, mold patches only where circulation is weak, or different stem firmness between center and edge. What to verify independently: inspect “within the row,” not only from the aisle; note how long leaves stay wet after sunset and after irrigations/mist. Practical decision: add a second air sensor “in-crop” (protected from splashing) in the densest area and compare it with an aisle reference sensor. Check the result: after airflow/ventilation adjustments, the gap between those two sensors should shrink and interior foliage should dry faster.
5) Irrigation and VPD: separating wrong settings from a sensor that triggers the wrong interventions
In cut flowers, irrigation directly affects turgor, stem thickness, and postharvest quality, but the link with VPD runs both ways: the air “pulls” water, and irrigation (or fogging) can raise local humidity and lower VPD without the plant necessarily being in a good balance. A common failure mode is “fixing” a high VPD with frequent irrigation when the real cause is overly warm air or a localized draft on the VPD sensor.
What to observe: very wet substrate but midday tip wilt, or a dry strip of benches even though greenhouse VPD does not explain it. What to verify independently: root-zone moisture (a dedicated substrate/soil moisture sensor, not an air sensor), uniformity of emitter flow (visual at drippers), and re-wetting time after an event. Practical decision: before changing schedules, confirm the VPD sensor represents the irrigated zone; if not, separate irrigation zones and compare substrate-moisture trends to VPD trends. Check the result: substrate moisture should follow a repeatable cycle and bench-to-bench differences should decrease.
6) EC and water quality: correct diagnosis requires knowing what you measure and where
In floriculture, salts influence water uptake and tissue firmness, but EC is not a “nutrient diagnosis,” and it does not identify which element is missing. EC also depends on the measurement medium: source water, fertigation solution, a substrate extract, or drainage are different things. A temperature sensor cannot measure EC/pH; you need dedicated probes and a consistent sampling/placement procedure to avoid comparing non-equivalent numbers.
What to observe: burnt margins, slow growth, or row-to-row variation after a fertilizer batch change or after refilling a tank. What to verify independently: periodic water analysis (pH, alkalinity, soluble salts) and comparisons between inlet-solution EC and drainage EC (if your system allows collection), while remembering they are different measurements. Practical decision: if EC seems high in only one point, first rule out a dirty probe or placement in a stratified area; then confirm with a manual measurement in the same medium. Check the result: look for a stable trend rather than a single value, and correlate with new growth appearance rather than older leaves.
7) Real problems vs misleading readings: a 20-minute verification protocol
When you receive an alert or see a deviation, start by checking whether data are fresh and coherent: a sensor that reports infrequently, shows jumps, or has “frozen” values can imitate a crop problem. Next, verify units and derivations: VPD is computed from temperature and humidity; if one input is wrong (for example, humidity overestimated by condensation on the sensor), VPD will be wrong as well. Only then treat it as a crop or equipment issue.
What to observe: one zone behaving completely differently from the rest without an obvious physical reason; or a difference that appears exactly when the greenhouse was washed down, fog was applied, or a fan was moved. What to verify independently: inspect the sensor (dirt, water, shading), do a quick comparison with a portable instrument, and compare with a second sensor in the same zone if available. Practical decision: run “three comparisons”: (1) another sensor, (2) a manual measurement, (3) crop observations. Check the result: if two of three agree, act; if not, fix placement/maintenance before changing irrigation or ventilation.
8) Comparing microclimates for consistent quality: testing an intervention and avoiding wrong conclusions
In cut flowers, consistent quality is often achieved more by reducing zone differences than by “optimizing” one greenhouse average. A robust approach is to treat interventions as small experiments: change one thing (for example, a vent opening, a screen position, a fan direction) and track how the difference between zones changes, not only the absolute value. If differences persist, the driver is likely structural (air paths, screens, density) rather than a simple setting.
What to observe: after an intervention one zone improves while another worsens; or VPD “stabilizes” but evening humidity spikes appear inside the canopy. What to verify independently: note time-to-dry after an irrigation/fog event, and assess uniformity of new stem growth over 7–10 days (indicative, without confusing varietal effects). Practical decision: set alert thresholds by zone, not by greenhouse, and validate them against history and crop observation—this is where a platform like GrowGuard can help keep zone comparisons consistent. Check the result: if alerts coincide with the moments you actually see the target symptom (condensation, wilt, fast dry-down), thresholds are useful; if they trigger “for nothing,” revisit zone definition or sensor placement.
Conclusion
Connected sensors can support consistency in cut-flower houses only if they correctly represent the microclimate within the plant mass and the root-zone/substrate. VPD is a useful orientation tool, but it can drive wrong interventions when it is calculated from measurements distorted by drafts, radiation, condensation, or convenient—rather than representative—placement. A solid diagnosis combines zone-to-zone comparisons, quick manual checks, and direct crop observation.
If you use GrowGuard or another monitoring platform, treat zone mapping and data audits as part of production routine: verify data freshness, coherence between sensors, and the link to what you see in-row. A simple invitation: build a minimal reference set for each house (air plus substrate) and review placement whenever the crop or density changes—before changing irrigation or ventilation strategy.