In greenhouse cut-flower production, quality shows in the details: stem length and stiffness, bud uniformity, color, and vase life. The problem is that the same cultivar, on the same day, can look different from one bench to the next simply because of microclimate. Small differences in temperature, humidity, and air movement change transpiration and, in turn, the water–calcium–carbohydrate balance.
VPD (vapor pressure deficit) is a practical way to describe “how strongly the air pulls water from the plant.” It is calculated from air temperature and relative humidity, so it is an estimate: the leaf can be cooler or warmer than the air, and inside the canopy there can be air layers with different humidity. Still, VPD helps you tie microclimate to repeatable decisions about irrigation, ventilation, and condensation management.
Connected sensors do not “solve” the crop, but they reduce guessing: they show where you have pockets of humid air, where substrate dries faster, or where irrigation does not arrive consistently. To get real benefit, the key is commissioning: correct sensor choice, zone-based placement, independent verification of measurements, and a clear workflow for response and validation after each intervention. This article describes that exact commissioning process for cut flowers.
1) Why VPD matters in cut flowers (the quality mechanism)
In cut-flower crops, transpiration directly influences the flow of water and calcium into young tissues. If the air “demands” a lot of water (high VPD), the plant can transpire excessively and slip into water stress between irrigations, especially in small-volume substrates. Depending on species and stage, the outcome can be slower growth, thinner stems, or buds developing unevenly, particularly where microclimate differs by only a little.
When air is too humid (low VPD), transpiration slows and plants may remain more “watery,” with slower drying after irrigation or overnight. What to observe: condensation on foliage or structure, persistent wet patches within the canopy, and vigor differences near walls or poorly mixed air. What to verify independently: temperature and RH in multiple points at crop height, plus a visual check for stagnant-air zones. Practical decision: align irrigation and ventilation with VPD dynamics, then check results by reduced between-zone differences and fewer hours of condensation.
2) VPD, humidity, and Botrytis: what sensors indicate—and what they do not
High humidity within the plant mass and weak ventilation increase the likelihood of conditions favorable to foliar diseases, and Botrytis is a frequent concern in cut flowers. Sensors help you identify a “risk window” by revealing long periods of near-saturated air and temperatures that allow water to remain on tissues. The mechanism is straightforward: if leaf surfaces stay wet for long enough, spores (if present) have a better chance to germinate and colonize.
A humidity graph or a risk alert does not confirm a pathogen and is not a diagnosis. Inoculum sources can include plant debris, planting material, or irrigation water; sensors only describe a conducive environment, not the causal agent. What to observe: zones where leaves stick together, flowers with petal damage after humid spells, corners with poor circulation. What to verify: hygiene routines, debris removal, water quality checks, and symptom scouting. Decision: schedule ventilation/dehumidification to avoid long humidity “plateaus,” then verify by comparing daily hours of very high humidity before and after the change.
3) Choosing sensors: what you measure in air vs. what you measure in the root zone
To work with VPD you need correctly measured air temperature and relative humidity at canopy level. Choose sensors with fast response and appropriate protection from radiation and condensation; otherwise you will see delayed or distorted values. For the root zone, a substrate (or soil) moisture sensor is essential to connect VPD-driven demand to actual water availability. In substrate systems, small differences in drainage and container volume can translate into rapid fluctuations.
Separately, pH and EC require dedicated probes and the method matters: EC in fertigation solution is not the same as EC from a substrate extract or bulk-soil EC. EC indicates the level of soluble salts; it does not tell you the concentration of each nutrient. What to observe: plants that look “thirsty” despite irrigation, tip damage, or slow growth; these can arise from microclimate or salinity. What to verify independently: periodic water analysis (pH, alkalinity, soluble salts) plus targeted measurements in the specific medium you are interpreting. Decision: define the medium for each measurement and use it only in that context, then watch whether crop responses match the data.
4) Zone placement: avoiding the “one sensor for the whole greenhouse” trap
In greenhouses with benches, hanging baskets, or long aisles, microclimate is rarely uniform. A sensor near a door, control cabinet, or well-ventilated spot may look “normal,” while the canopy center has saturated air and wet leaves. Correct placement means: at plant height, in zones with different airflow (greenhouse ends, corners, near screens, under hanging crops), and in suspected condensation or overheating points.
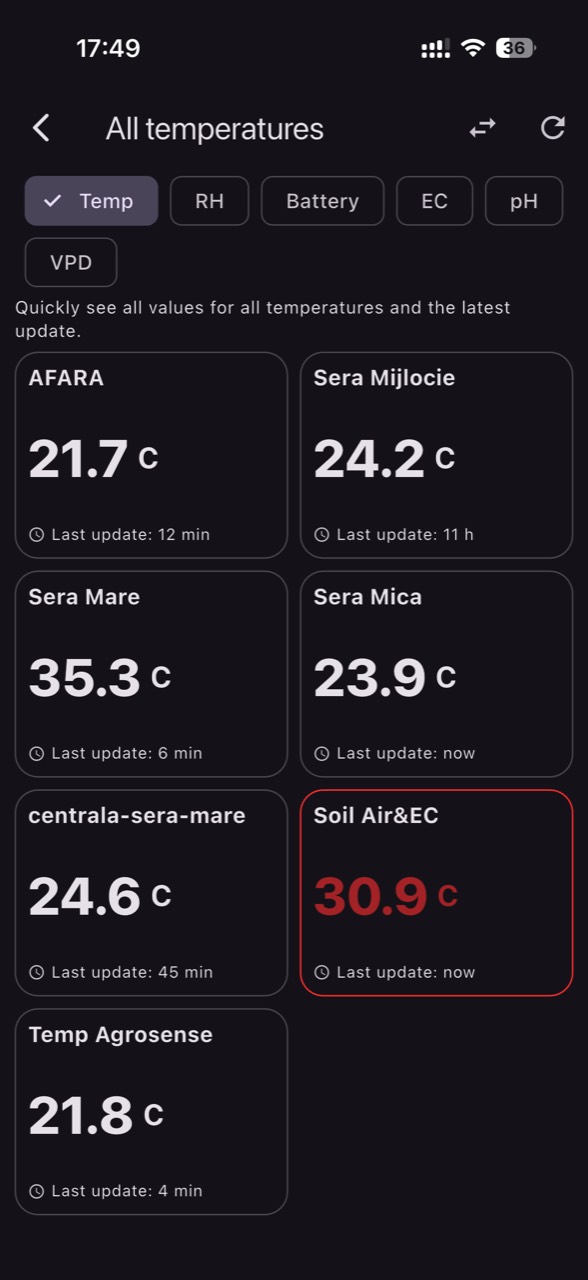
Zone commissioning starts with a simple map: divide the greenhouse into operational zones (for example by air circuit, heat sources, crop type, or density). What to observe: flowering timing or stem thickness differences that correlate with location. What to verify: a validation walk with a portable T/RH instrument at key hours (early morning, after irrigation, midday). Decision: move/add sensors until problem zones are covered; verification comes when zone graphs explain crop differences rather than hiding them under an “average.”
5) A 7-step commissioning workflow: from installation to useful thresholds
Step 1: define the purpose of each sensor (VPD for microclimate, moisture for irrigation, and optionally pH/EC for solution or substrate). Step 2: confirm units and plausible ranges: temperature in °C, RH in %, VPD in kPa (or your system’s unit), and for substrate moisture note the type (volumetric, tensiometric, etc.) and whether it fits the medium. Step 3: confirm data freshness (reporting frequency) and what the system does during signal loss or low battery.
Step 4: initial calibration/validation. Do not assume two sensors should match; check whether differences are plausible for two microclimates. Step 5: set provisional thresholds from your first 7–14 days of history rather than universal “templates.” Step 6: define an operational response for each alert (who checks, how fast, what gets adjusted). Step 7: after each intervention, verify the effect in both data and crop. With GrowGuard, it can be easier to tie thresholds to real zones and receive parameter alerts, but value comes from discipline in these steps.
6) Irrigation linked to VPD: moving from fixed schedules to real demand
In cut flowers, irrigation is not only about preventing wilting; it is about maintaining a stable plant balance without large swings in root-zone water and salts. When VPD rises, water demand rises; if substrate moisture is near its lower limit, stress appears quickly. What to observe: slight midday flagging, more sensitive shoot tips, growth that looks intermittently interrupted. What to verify: substrate moisture immediately before and after irrigation, and uniformity across irrigation lines.
The practical decision is to use VPD as “context.” If a day has high demand (higher VPD), check whether your irrigation strategy covers critical hours without pushing the crop into over-wet conditions late afternoon or night. Hypothetical example: two zones run the same program, but one has higher midday VPD and its substrate moisture drops faster; you adjust duration/frequency for that zone only (or investigate a cause such as flow, clogging, pressure). Verify results by a more stable moisture curve and reduced zone-to-zone divergence on similar weather days.
7) Common failures: “good” data that leads to bad decisions
A typical case is a T/RH sensor mounted too close to a heat source or in direct sun: it will report higher temperature, lower RH, and an apparently “dangerous” VPD, pushing you toward unnecessary ventilation or over-irrigation. Another failure is placing the sensor inside the canopy but touching wet leaves; RH can remain artificially high. What to observe: VPD that jumps without weather changes, or two zones swapping behavior with no plausible explanation. What to verify: placement, radiation shielding, and comparison to a control instrument next to the sensor.
In irrigation, a frequent failure is misreading EC. EC in the tank can stay stable while root-zone EC increases due to evaporation and selective uptake, especially when VPD is high and irrigations are infrequent. Conversely, high drainage can mask accumulation in spots where drip distribution is uneven. Decision: before changing a fertigation recipe, confirm the measurement medium (solution vs. substrate extract) and check flow/clogging. Verification: after correction, EC curves (in the chosen medium) and plant response become coherent—not merely “lower” or “higher.”
8) Weekly routine: keeping quality consistent rather than “firefighting”
Stability comes from routine. Once per week, choose two representative days and compare: how long very high humidity periods lasted, when VPD extremes occurred, and how quickly the substrate recovers after irrigation. What to observe: if the same zones show the same issues after each weather shift, you likely have a structural cause (air circulation, screens, density, heating differences). What to verify: a physical inspection of those zones and a sensor check (battery, signal, stuck values).
Then convert findings into small, measurable actions: local ventilation adjustments, fixes in water distribution, zone-based schedule tweaks. In a monitoring system like GrowGuard, you can follow zone history and set alerts that catch those specific problematic windows, but the target remains operational: the same quality batch after batch. Verification is not only on graphs; it is in stem uniformity and a narrowing gap between “good benches” and “problem benches” over the next two cycles.
Conclusion
VPD is not a “magic setpoint,” and sensors do not replace direct observation. Together, however, they give you a shared language between microclimate and irrigation: what is happening, where it is happening, and how long it lasts. For cut flowers, that translates into repeatable decisions: manage foliage drying, synchronize irrigation with real demand, and reduce zone-to-zone variation that ruins uniformity.
If you want to commission a zone-based system without getting stuck in details, start with 2–3 critical zones, validate measurements with independent checks, and build thresholds from your own history. When you are ready to centralize data and alerts for the team, GrowGuard can serve as the monitoring platform and an operational discipline tool; request a commissioning discussion and begin with small, measurable steps.