In cut-flower greenhouses, quality losses often start before they are obvious at first glance. Botrytis doesn’t “arrive” from a single cause, but from a combination: high humidity inside the plant mass, leaves and petals that stay wet, and weak air movement. Small zone differences quickly become big differences in grading, vase life, and batch uniformity.
Condensation is a practical warning sign: somewhere, humid air has cooled below its dew point, and surfaces (film, metal, leaves) have become cold enough for water to deposit. For cut flowers, any period with wet tissues increases the risk of spotting, rot, and rejection at sorting. The challenge is that “condensation” is rarely uniform across a greenhouse; it forms in islands.
Temperature and humidity alerts can help you catch risk windows and send the team to check the right place at the right time. But an alert cannot confirm a pathogen and cannot make a diagnosis. Microclimate data only indicates conducive conditions; inoculum can persist in plant debris, planting material, or water. A sound protocol combines zone data with disciplined crop inspection.
1) Why Botrytis benefits from the microclimate inside the plant mass
Botrytis has a built-in advantage in cut flowers because it can exploit delicate floral organs and vulnerable tissues—especially when they remain wet. Dense crops, overlapping foliage, and petal layers create an “interior” with limited air exchange. Even if the aisle climate looks acceptable, humidity can stay high in the canopy, and drying after irrigation, misting, or night cooling can be slow. That extended wetness is the risk window you manage.
In practice, note where first symptoms tend to show up: bench edges, corners, under hanging baskets, or near screens. Independently verify what the crop is experiencing: wet leaf or petal surfaces to the touch, the smell of persistently damp vegetation, softened tissues, or unremoved plant debris. The practical decision is not an automatic spray, but shortening wet periods—targeted ventilation/recirculation, relieving congested spots, and strict cutting hygiene. Check the result with an early-morning walk: drier surfaces and fewer areas that stay wet.
2) Condensation: dew point mechanics and why it appears by zones
Condensation forms when a surface is colder than the humid air around it, causing water vapor to deposit as liquid water. In a greenhouse, cold surfaces can include film or glass, metal profiles, pipes, and even leaves cooled by night-time radiation. Zone differences are driven by airflow patterns, thermal bridges, proximity to exterior walls, shading under screens, and uneven heating distribution. Wherever you have “cool + humid,” you have a localized risk hotspot.
What to observe: droplets on cladding, run-off on posts, glossy leaves in the morning, and localized spotting beneath condensation drip lines. What to verify independently: surface temperatures (hypothetically with an IR thermometer), whether heating is truly reaching the cold corner, and whether screens are limiting air exchange too much. The practical decision is to reduce the air–surface temperature gap: maintain minimal air movement and manage screens/heating to avoid abrupt cooling. Check over the next nights whether condensation “islands” shrink and become less frequent.
3) Temperature and humidity: why one measurement point can mislead you
In floriculture it’s tempting to rely on a single sensor near the climate controller and assume the whole greenhouse matches it—benches, hanging crops, and row ends alike. In reality, temperature and humidity stratify: warmer air rises, while sheltered zones retain humidity. A frequently used door, a failed fan, or a section with heavier plant mass can completely change local readings. Botrytis exploits exactly these inconsistencies between zones.
What to observe: uneven batches, areas where the crop takes longer to dry after irrigation, or differences in stem firmness and color at harvest. What to verify independently: compare (hypothetically) leaf wetness at two ends of the same bay and note the time each side fully dries. The practical decision is to zone your monitoring: place sensors at crop height in zones with different airflow, not only near entrances or cabinets. Check the outcome through converging zone curves and fewer quality deviations during sorting.
4) VPD as a drying indicator: helpful, but not a “wet-leaf detector”
VPD (vapor pressure deficit) is calculated from air temperature and relative humidity and estimates how strongly the air can pull water from leaves. Conceptually, low VPD means near-saturated air: drying is slow and leaf wetness can persist. The key caution is that VPD is an air-based estimate; leaf temperature can differ from air temperature—especially at night or under radiation—so VPD does not perfectly represent the true wetness condition on petals and leaves.
What to observe: low-VPD windows often coincide with more condensation, petals sticking together, and a canopy that feels “closed” or stagnant. What to verify independently: touch leaves/petals for a water film and check whether air is stagnant inside the canopy. The practical decision is to use VPD as a trigger for scouting and small adjustments: a modest ventilation/recirculation step or a heating strategy that accelerates drying without abrupt thermal stress. Check results the next morning: leaves dry earlier and very-low-VPD periods shorten.
5) Sensor choice and placement for “zone condensation” in cut flowers
To track condensation and Botrytis risk, you primarily need correctly placed air temperature and relative humidity sensors. In cut flowers, “correctly” means at crop level in the relevant air mass, shielded from direct heating jets or cold ventilation blasts. Avoid convenient but unrepresentative spots: by doors, next to control panels, or high above walkways in empty air. Choose points that clearly separate distinct microclimates (corner vs center, under-screen vs open, dense canopy vs lighter area).
Commissioning checks matter: confirm units (°C and %RH), reporting interval, and data freshness—an alert based on delayed readings may send the team too late. Also check for drift or placement artifacts: if two nearby sensors consistently disagree in implausible ways, shading, radiation, or calibration may be involved. The practical decision is to add at least one measurement point in a “suspect” area (corner, under a screen, distant end) and compare it to a reference zone. Confirm by targeted walkthroughs exactly when charts show near-saturation conditions.
6) Alerts: how to set them to support inspection—not replace it
A good alert doesn’t say “you have Botrytis.” It says “you have a temperature/humidity combination that can keep tissues wet.” Set alerts using your own history: identify the days/hours when you actually found condensation or symptoms, then look at what zone readings looked like at those moments. Universal thresholds are risky in cut flowers because species, canopy density, and harvest routines change microclimate behavior. Alerts must be actionable: infrequent, clear, and tied to meaningful zones.
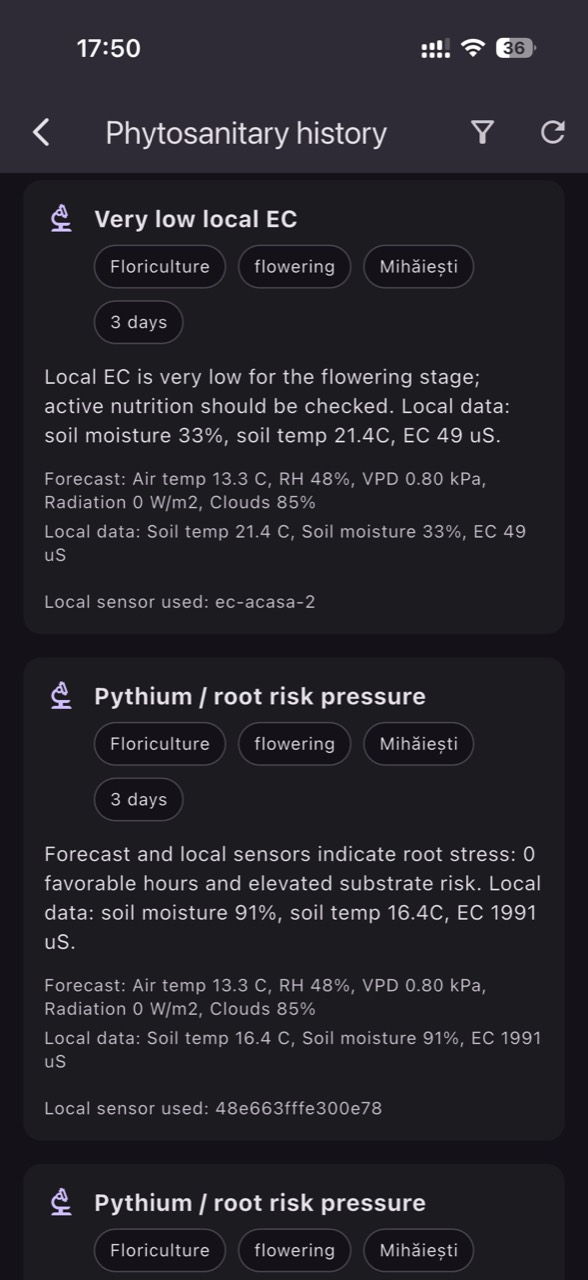
What to verify independently each time an alert triggers: are leaves/petals wet, is there plant debris or fallen flowers, is a fan off, are screens closing too early, is heating absent in a corner? The practical decision should be small and reversible: a short venting event, increased air movement in one zone, a screen-management tweak, or a hygiene round. In GrowGuard, zone-based temperature/humidity alerts can direct the team to the problematic “island”; check success by fewer repeat alerts in the same zone and scouting that confirms faster drying.
7) Phytosanitary and hygiene checks: conducive conditions don’t mean inoculum is absent
Microclimate data can indicate favorable conditions, but the pathogen still needs sources: plant debris, infected plants, contaminated pots/substrate, water that carries spores, or tools that spread them. In cut flowers, frequent cutting and handling create wounds and generate residual plant material; if it remains inside the greenhouse, inoculum pressure increases. That is why a minimum protocol for hygiene and waste removal matters as much as climate settings when you are trying to reduce recurring hotspots.
What to observe: debris under benches, yellowing leaves trapped inside the canopy, over-mature flowers left on plants, and wet crates or carts. What to verify independently: the debris collection route and dwell time, cleanliness of shears and work surfaces, and—if overhead irrigation is used—whether petals are being splashed. The practical decision is a routine: daily removal of residues from zones with repeated alerts and separation of sensitive lots where feasible. Check results by fewer symptom recurrences in the same points and a canopy that is visibly more aerated.
8) After an intervention: proving you reduced risk, not just “changed charts”
Any ventilation, heating, or screen adjustment should be evaluated by its effect on the crop—not only by what averages look like. In cut flowers, the practical goal is to shorten how long petals and leaves remain wet while maintaining growth rhythm and stem quality. An adjustment can simply move the problem: for example, one corner dries better but a cold draft appears elsewhere. That is why verification must remain zone-based and focused on key hours (evening–night–morning).
What to observe: time to complete drying after irrigation, the distribution of condensation, and uniformity of stems and flower opening. What to verify independently: a scheduled inspection (hypothetically) in two windows—1–2 hours after sunset and before sunrise—plus spot checks of known cold surfaces. The practical decision is to keep changes that reduce repeated alerts in the same zone without visible stress (wilting, scorched tips, slowed growth). In GrowGuard you can compare zone history to see whether risk windows shortened; the final confirmation remains in the crop: fewer grading losses and fewer symptom “islands.”
Conclusion
Botrytis, condensation, and high humidity in cut-flower greenhouses are zone microclimate problems, not just a greenhouse-average problem. When you understand dew point mechanics and use temperature/humidity (and, when helpful, VPD) as risk indicators, you can shift from late reactions to small, targeted, verifiable interventions inside the crop.
Alerts are valuable when they send the team to inspect the right place at the right time—without pretending to detect pathogens or replace diagnosis. If you want, you can configure zone monitoring and temperature/humidity/VPD alerts in GrowGuard to support scouting routines and document which interventions truly reduce wetness windows inside the canopy.