In flower greenhouses, small differences in temperature, humidity, and air movement can shift quality: longer or shorter stems, uneven buds, and higher sensitivity to Botrytis during leaf-wet moments. The problem starts when decisions are based on one poorly placed sensor: it “sees” a cold corner or an air jet, and the graph makes it look like the whole house is in crisis.
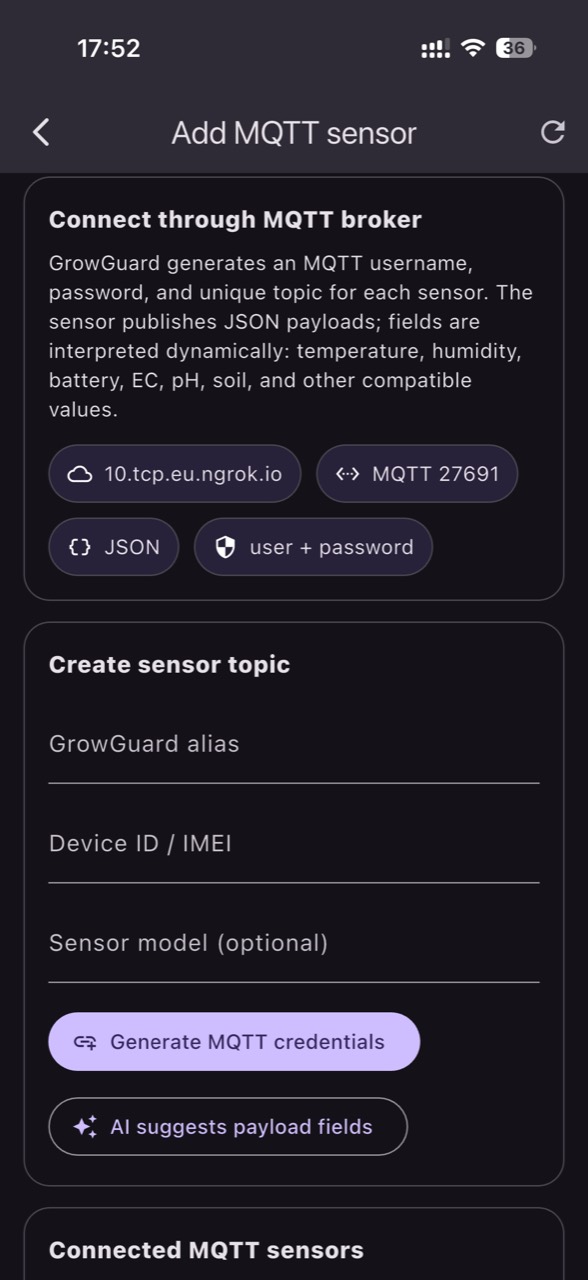
When you connect sensors via MQTT, data can arrive quickly and consistently, but that does not mean it describes the plant correctly. MQTT is a broker-based publish/subscribe protocol with topics; delivery confirmation (QoS) only confirms message transport, not that ventilation, heating, or fogging actually happened physically. That gap is where wrong diagnoses start if you do not verify on site.
This article is a diagnostic guide: how to distinguish a real crop or equipment problem from a misleading reading; how to compare microclimates between crop zones; and how to validate the effect of an automation. Examples are hypothetical and focus on the mechanism: what you observe on plants, what you verify independently, what decision you take, and how you confirm the result afterward.
1) Start with a microclimate “map”, not a single number
A flower greenhouse has predictable microclimates: infiltration near doors and curtain edges, air jets under vents, colder end bays, and humidity accumulation inside dense canopies. The mechanism is straightforward: air moves unevenly, while radiation and cold/warm surfaces create stratification. First, observe whether symptoms are “patchy” (only in bands, rows, or corners) or uniform. Patchiness usually points to a zone effect before it points to a whole-house climate failure.
Independent verification starts with a mobile measurement (a handheld thermometer/hygrometer or a reference probe) and a walk-through at the same time-of-day when the anomaly appears. Practical decision: divide the greenhouse into crop zones (for example west end, center, door side) and compare zones rather than chasing an “average”. In GrowGuard you can follow readings by zone; confirmation is when differences stay stable over time and match symptoms in those same zones.
2) Air sensor placement: avoiding drafts, sun loading, and cold walls
A temperature/RH sensor too close to a vent, fan, heater, or thermal screen measures “forced” air, not the air the plant experiences. Likewise, direct sun can heat the housing and inflate temperature, while a cold wall can locally depress temperature and push relative humidity up through cooling. Look for typical signatures: abrupt swings synchronized with equipment on/off, midday peaks on clear days, or “high humidity” readings without visible condensation anywhere that makes sense.
Verify independently with temporary repositioning: move the sensor 1–2 meters inward and compare curves over 24–48 hours (hypothetical). Decision: mount the sensor at a canopy-relevant height, in a representative area, shielded from direct radiation and away from direct air streams and cold surfaces. Check the result by looking for a more physical curve (gradual changes) and zone-to-zone differences that match structure and management, not random mounting points.
3) VPD and “stress” that may be only a wrong estimate
VPD is derived from air temperature and relative humidity; it estimates evaporative demand, not transpiration itself. In flower greenhouses, leaf temperature can differ from air temperature: under strong radiation leaves may heat up, while under a thermal screen or after fine mist they may cool. This mechanism can mislead you: a “good” VPD at the sensor can coexist with wet leaves and Botrytis-conducive conditions deeper in the canopy.
Observe biological signals: soft leaves in the morning, tip scorch (possible evaporative stress), or condensation patches inside the plant mass. Verify independently by inspecting leaves (dry vs wet) and, if available, spot-checking leaf temperature with an IR thermometer (hypothetical) and comparing it to air temperature. Decision: use VPD as a trend indicator and set zone-based thresholds, then ground-truth in the crop. In GrowGuard, VPD can support alerts, but confirmation must be agronomic: better uniformity and fewer wet-leaf episodes in the corrected zone.
4) Root-zone sensors: watering “by number” vs watering “by plant”
For potted flowers or substrate-grown systems, the difference between a well-placed sensor and one stuck on the “edge” can flip your diagnosis. Mechanism: water distribution is not uniform (more under a dripper, less between plants), and edge pots dry faster due to airflow and temperature gradients. A probe too close to the emitter may suggest overwatering while most of the root ball is actually in deficit. Observe uneven plants within the same zone, light pots next to heavy ones, or roots developing mainly on one side.
Verify independently with simple cross-checks: manual weighing of a few pots (hypothetical), root inspection on a small sample, and a drainage check after an irrigation event. Decision: place the probe in the active root volume that represents the majority of plants, and define crop zones according to the irrigation circuit rather than only greenhouse geometry. Confirm the result by watching for convergence between pot weights, root appearance, and the sensor curve after you adjust duration/frequency.
5) EC and pH: what they measure, in what medium, and why “anomalies” happen
EC and pH cannot be inferred from temperature; they require dedicated probes, and interpretation depends on medium and method. EC in drain solution (or an extract) is not identical to EC in the root-zone solution, and it does not tell you which nutrient is missing; it indicates total salinity. The “false alarm” mechanism is common: sampling right after fertigation, poorly mixed drain, or a probe with deposits can show a jump that the plant does not experience. Watch for short spikes that do not match symptoms, or values stuck at a single number.
Verify independently using a calibrated handheld meter and by comparing timing (before vs after fertigation). Decision: standardize sampling timing and explicitly record the method (drain, in-line solution, extract). If you suspect the probe, clean and recalibrate according to the manufacturer’s instructions, then follow the trend rather than one-off points. Confirmation is coherent trends that align with management actions (flushes, recipe changes) and real crop signals—not isolated impulses.
6) MQTT in practice: data freshness, retained messages, and unconfirmed “actions”
In an MQTT integration, data flows through a broker on topics; retained messages can exist, and QoS levels can be used. A misleading-reading mechanism is that a dashboard may show an old retained value after a network drop, or a QoS-delivered message may be mistaken for “fresh” measurement. Separately, a delivered message does not confirm that an actuator executed a command in the real world. Observe warning patterns: jumps that look like “going back in time”, gaps followed by a value that appears current, or alerts firing immediately after reconnection.
Verify independently by checking the data “age” (timestamp) and the expected reporting interval for that sensor. Decision: enforce commissioning rules: each MQTT stream should carry measurement time, units, and a stable identifier; for retained messages, apply a “too old” logic check before treating them as current. In GrowGuard, use history and sensor-status alerts to detect gaps; confirmation is that alerts caused by stale values disappear and events align clearly with actual measurement timing.
7) Automation: separating a real malfunction from a reaction to a wrong sensor
Greenhouse automations (ventilation, heating, shading, fine mist) can amplify a measurement error: a sensor sitting in a draft may trigger needless venting, which cools a zone and creates condensation; then the same sensor “confirms” high humidity and the cycle repeats. The mechanism is a feedback loop built on a non-representative reading. Observe frequent short cycles that do not match the general greenhouse condition, and flower damage concentrated near drafts, doors, or air outlets.
Verify independently with a controlled test (hypothetical): pause the automation briefly and monitor with a reference sensor in a representative spot, while protecting the crop and respecting safety constraints. Decision: before you “tune thresholds”, validate the sensor and its placement; then apply zone-based thresholds rather than whole-house settings when zones behave differently. Confirm results by reduced unnecessary cycling and a stabilized microclimate, visible in curves and in improved uniformity across the affected zones.
8) A 48-hour diagnostic protocol: compare, confirm, then intervene
When an alert or suspicious graph appears, treat it as a short investigation. Mechanism: there are three cause families—real zone microclimate, placement/calibration problem (sensor), or execution problem (equipment/automation). Observe plants first: symptom distribution, the hours when it appears, and whether it affects only one cultivar/lot (flowers differ in sensitivity to humidity and temperature depending on growth stage). In parallel, decide if the anomaly is a trend or a single spike.
Verify independently with a simple sequence: (1) a mobile reference point; (2) a second measurement in the same zone; (3) a visual equipment check (doors, fans, heating, curtains); (4) MQTT data freshness and units verification. Decision: intervene first on the highest-probability, lowest-risk cause (repositioning, shielding, probe cleaning), and only then adjust control settings. Confirm by logging before/after in the same time window and checking that the change shows up in the microclimate and the plants, not only in the sensor.
Conclusion
In flower greenhouses, correct diagnosis starts with “which zone does this sensor describe?” and only then “what value is it showing?”. When placement is representative, when EC/pH are interpreted in the correct medium, and when VPD is treated as an estimate validated on the plant, microclimate differences become a tool: you can identify cold ends, irrigation bands that behave differently, drafts, and condensation windows that affect quality.
If you already use MQTT sensors and want fewer misleading alerts, build a short verification protocol and keep zone history as evidence. GrowGuard can help with monitoring, zones, and sensor-status alerts, but results are always confirmed in the greenhouse: the same issue should be visible in plants, equipment, and data, in the same time order. For any automation project, separate monitoring from execution and validate each loop with an independent measurement before leaving it “on autopilot”.