In flower greenhouses, the difference between an even batch and one with stress peaks often comes from microclimate: air that becomes too dry after heating, high humidity in cold corners, local drafts, or delayed ventilation response. Sensors help, but only if they are chosen correctly, installed carefully, and interpreted as a system rather than isolated numbers.
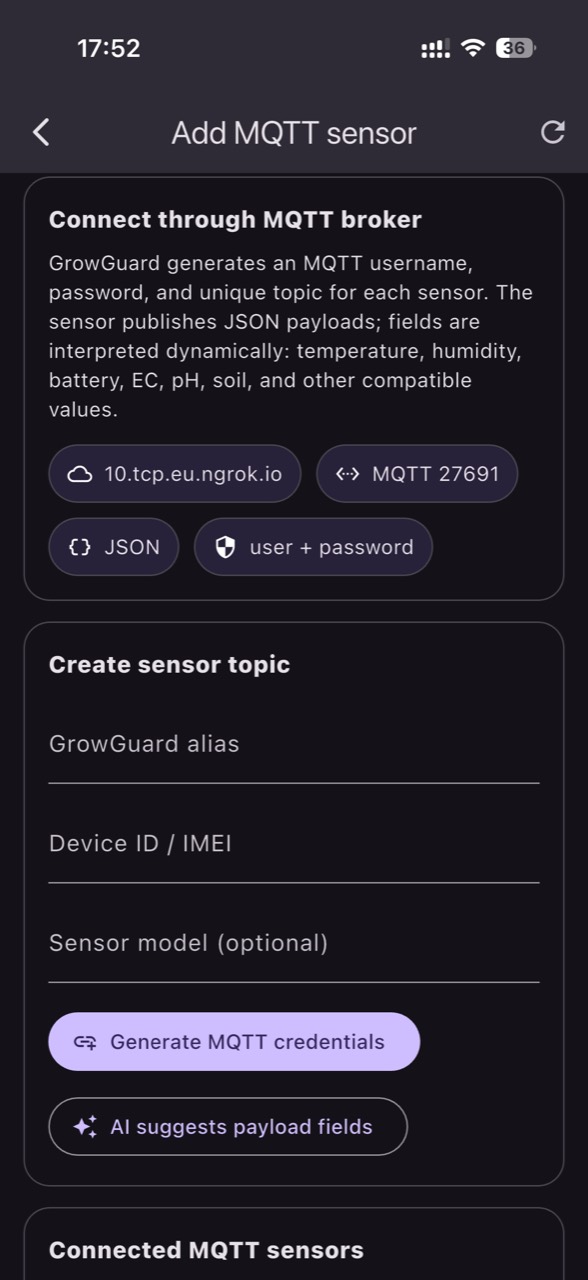
MQTT is often used as a “language” between sensors, gateways, controllers, and applications. Because it is broker-based publish/subscribe built on topics, MQTT can move data quickly in a standardized way, but it does not guarantee that a physical action (for example, starting a fan) actually happened. That is why commissioning must include independent checks and on-site confirmations.
The article below explains technical fundamentals and a usable commissioning workflow for a flower greenhouse: which parameters are worth monitoring, how to design MQTT topics and data freshness, how to connect automation without confusing “command” with “result,” and how to verify that interventions truly change the microclimate. Examples are hypothetical and indicative.
1) Flower microclimate: mechanisms that require fine measurement
Cut flowers and potted flowers respond quickly to transpiration imbalance, especially when you move between heating, ventilation, and shading. The air may look “fine” at greenhouse level, yet the leaf can be cooler (at night, near film) or warmer (under radiation), and VPD calculated from air temperature and relative humidity remains only an estimate. That makes both sensor placement and interpretation critical.
What you observe: differences in growth rhythm, thinner stems in drafty areas, midday tip wilting, or morning condensation. What you verify independently: a portable thermometer/hygrometer for spot checks, visual inspection of condensation on surfaces, and, if available, leaf temperature with an IR tool (only as a check, not as a setpoint). Practical decision: adjust the ventilation–heating sequence or shading. Result check: compare before/after in the same zones at the same times of day, not only as a daily average.
2) Choosing sensors: measurement medium, units, and common traps
In flower greenhouses, the base layer is air temperature and relative humidity, then (optionally) CO2, substrate/soil temperature, and root-zone moisture. Important: a temperature sensor does not measure EC or pH; those require dedicated probes installed in the correct medium. For EC, you must clarify whether you mean irrigation water, drain, nutrient solution, or substrate; the same numeric value in different media does not carry the same agronomic meaning.
What you observe in data: improbable jumps, stuck values, strange synchronization between channels (for example, a constant 100% RH). What you verify independently: the units (°C, %RH, ppm, mS/cm), the sensor’s operating conditions, and the installation method (radiation shield, distance from fog nozzles, position relative to heaters). Practical decision: use different sensors for air vs. root zone and define exactly what the EC channel represents. Result check: label the channel clearly (e.g., “Drain EC”) and confirm with periodic manual measurements.
3) MQTT in practice: topics, QoS, and retained messages
MQTT works with a broker: devices publish messages on topics, and applications or other devices subscribe to them. Topics must be designed so you avoid confusion between locations, sensors, and data types. A hypothetical example: greenhouses/flowers/house1/zoneA/climate/sensor12/temperature. QoS can improve message delivery reliability, but a QoS acknowledgement is not proof of a physical action; it is only confirmation at the protocol transport level.
What you observe: delayed, duplicated, or missing messages, especially under unstable connectivity. What you verify independently: timestamps in the payload, time monotonicity (it always moves forward), and whether the broker uses retained messages. Retained messages may deliver the “last message” immediately to a new subscriber; therefore you must check data age (freshness) before decisions. Practical decision: include a time field and a sequence number in the payload. Result check: simulate a client reconnect and confirm it does not trigger alerts from stale retained data.
4) Data freshness and integrity: from “it arrives” to “it is actionable”
In automation, the rare problem is “no data”; the common problem is “data exists, but it is no longer current.” In greenhouses, a delay of minutes can change interpretation: a humidity spike after fogging or a temperature peak around midday. Define clearly: sampling interval (how often you measure), publishing interval (how often you transmit), and an operational SLA (how old data can be and still be useful).
What you observe: charts with large “steps,” gaps with no points, or suspiciously perfect correlations (a sign of replicated values). What you verify independently: compare with a local logger, or at least with greenhouse observations at key hours; check battery and link quality indicators if available. Practical decision: set “sensor offline” alerts and latency thresholds. Result check: after a day, review history and see whether alerts matched real events (Wi‑Fi drops, power interruptions) or configuration mistakes.
5) Commissioning the installation: placement, labeling, and plausibility testing
A useful workflow starts with a simple greenhouse map: heating zones, row ends, doors, fans, thermal/shade screens, fog sources. Each sensor gets a logical ID and a position description (for example, “1 m above canopy, 3 m from the north wall”). Then run a plausibility test: if heating turns on, you expect a coherent temperature change and, over time, a change in %RH and estimated VPD.
What you observe: large differences between sensors in the same zone, or the opposite—sensors in different zones reading identically. What you verify independently: whether the sensor sits in direct hot-air jet flow or near a cold surface; whether it has radiation shielding; whether it is being wetted directly. Practical decision: relocate “contaminated” sensors influenced by local sources, or redefine them as “equipment sensors” (monitoring machinery) rather than plant microclimate. Result check: repeat the same heating/ventilation sequence and see if the response becomes more consistent.
6) From monitoring to automation: separate command from feedback
Correct automation has two loops: the command (what you tell equipment to do) and the feedback (what actually happened in the greenhouse). In MQTT, a command may be a message on a control topic, while feedback comes from sensors on measurement topics. Do not confuse “command sent” with “command executed.” In a hypothetical scenario, you send “open vent 20%,” but the motor may be jammed; only the microclimate change and/or a position contact can confirm the effect.
What you observe: the automation appears “active” (commands are being sent), but temperature/humidity does not change, or changes the wrong way. What you verify independently: mechanical operation (visual/audible), electrical supply, and, if present, a separate status signal from the controller (not embedded in the same command message). Practical decision: define “expected effect” criteria (e.g., after ventilation starts, the temperature trend reverses within X minutes) and alert when the effect is absent. Result check: after several cycles, note how many commands produced the intended effect and adjust logic or maintenance accordingly.
7) Useful alerts: thresholds on trends, not only fixed values
In flower greenhouses, “fixed” alerts can create noise: high relative humidity may be normal in the morning, but problematic if it persists in cold zones or combines with low temperature and weak air movement. More robust is alerting on persistence, rate of change, and differences between zones. A hypothetical example: “%RH above threshold for more than N minutes” or “temperature difference between zone A and B above threshold.”
What you observe: many alerts without action, or alerts being ignored, which is a design failure. What you verify independently: whether the threshold reflects your crop reality (species, stage, density, substrate) and whether the sensor location is representative. Practical decision: adjust thresholds after two weeks of history and greenhouse observations; keep status alerts (battery, offline) separate from agronomic alerts. Result check: track how many alerts led to intervention and whether the intervention changed the trend on the graph. In GrowGuard, you can manage zone-based alerts so you do not treat the greenhouse as a single point.
8) Post-intervention validation: how to prove the automation helps
Commissioning is not finished when “data appears” or when “automation runs,” but when you can repeatedly demonstrate that the intervention produces the intended effect without unwanted side effects. For flowers, typical side effects include drafts that locally dehydrate plants, excessive cooling near vents, or humidity buildup in shaded areas. Use a simple method: define an analysis window (before/after), the same time of day, and as similar weather conditions as possible.
What you observe: improvement in one zone and deterioration in another, indicating uneven air distribution. What you verify independently: walk the greenhouse immediately after intervention; look for condensation, smell differences (stale air), leaf movement, and, if needed, measure extra points with a handheld instrument. Practical decision: change sequencing (for example, shorter, more frequent pulses) or add a lockout condition (do not vent if outside air is too cold and shock risk is high). Result check: compare zone curves and confirm spatial variation decreases. GrowGuard’s history and reports can help keep this validation as an operating routine rather than a one-time project.
Conclusion
A good sensor and MQTT system in flower greenhouses is not only about connectivity, but about technical discipline: clear measurement medium, correct units, coherent topics, freshness checks, and—most of all—separating command from feedback. Automation becomes safer when it is validated through its effect on the microclimate by zone, and when typical failures (stale data, retained messages, poorly placed sensors) are anticipated.
If you want to structure this commissioning as a team workflow, GrowGuard can be used for zone monitoring, alerts, and history, while the automation remains a separate project connected via MQTT. For a practical discussion of your architecture (broker, sensors, zones, and validation tests), you can request a commissioning plan tailored to your greenhouse.