Late frost and heat waves cause damage not only through extremes, but through exposure time and microclimate differences. A single “farm value” can hide the fact that one corner of an orchard sits in a temperature inversion, or that a tunnel spikes under plastic. Effective protection starts with zone-level data and a clear decision protocol.
Forecast helps, but it is not enough: it has limited resolution and can miss fog, local wind, or slope effects. In practice, treat it as context and anchor it in real measurements: air temperature, relative humidity, sometimes temperature at the level of sensitive organs (buds/leaves), plus stress indicators (for example, VPD estimated from air T/RH).
This article explains the fundamentals and a commissioning workflow: how to define different thresholds by zone, how to independently verify risk before acting, and how to run a post-event evaluation to improve settings. The examples are hypothetical and do not provide universal setpoints; the goal is to help you build thresholds specific to your crop and site.
1) Understand the mechanism: why the same night affects zones differently
In frost, the critical mechanism is radiative heat loss and cold-air pooling in low spots. In orchards, buds and blossoms can become colder than air measured “at the end of the row,” especially on clear, calm nights. In greenhouses and tunnels, the risk is stratification: the floor and crop canopy may cool more than air at 2 m, and openings can create localized cold drafts.
In heat waves, damage comes from tissue overheating, reduced photosynthesis, flower abortion, and water stress. In protected structures, radiation and limited air exchange can raise leaf temperature quickly; VPD calculated from air temperature and humidity is only an estimate because leaves may be warmer than air. What to observe: short midday peaks, zones that stay “hot” after venting, or plants that show temporary wilting. What to verify independently: actual plant condition and, if possible, leaf temperature with an IR thermometer so you do not confuse air with tissue.
2) Build a data picture: which sensors you need and what they do not measure
For frost and heat waves, the base is air temperature and relative humidity measured at crop-relevant height and in multiple points. In an orchard, it makes sense to place one point in an inversion-prone area and one in a “typical” area; in a greenhouse, one at leaf level and one in a suspect zone (doors, row ends, near walls). If you use VPD, remember it is derived from T/RH and does not directly include leaf temperature or localized air movement.
Keep measurements distinct: a temperature sensor does not measure pH or EC; those require dedicated probes. And EC is meaningful only if you state the medium and method: EC in irrigation water, EC in fertigation solution, EC from a substrate extract, and EC in bulk soil are different measurements and should not be compared directly. On-site pH/EC monitoring complements laboratory analysis, not replaces it; use it to interpret whether heat stress is worsened by salinity or unsuitable water, without concluding anything about individual nutrients from EC alone.
3) Forecast as a trigger: how to turn it into an operational plan
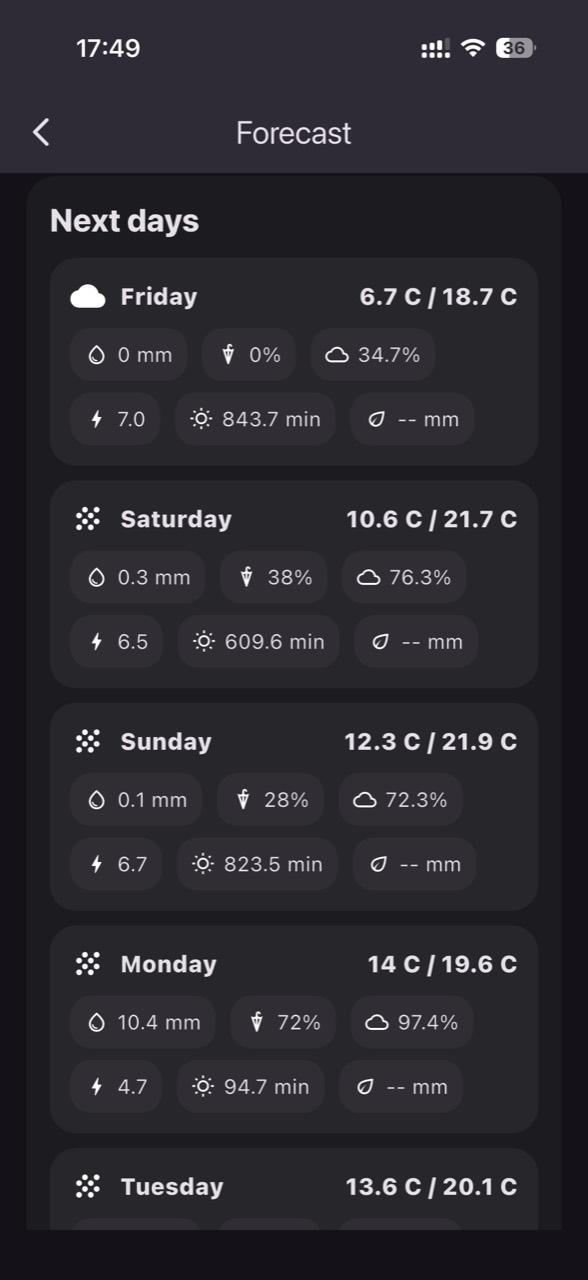
Use the forecast to trigger preparation, not automatic intervention. Mechanism: 24–72 hours ahead you can allocate resources (staff, fuel, shade materials, system checks), and 6–12 hours ahead you can decide whether to move into active surveillance. What to observe: the gap between forecast minimum temperature and dew point, probability of clear sky, and wind speed; these suggest whether the risk is radiative (“dry” frost) or advective (cold wind), and whether the night may stay humid, which can complicate some physiological issues.
Independent verification: compare the forecast with your site’s own history. If in recent events you consistently saw your “low pocket” drop 2–3 degrees below the middle zone (hypothetical example), the plan must start from the critical zone, not the farm average. The practical decision is to set a forecast-based “pre-alert” stage (for example, when the predicted minimum approaches your internal threshold), then require confirmation from real-time measurements. After the event, check whether the pre-alert provided enough lead time: how many hours passed between the signal and the first threshold exceedance on-site.
4) Zone thresholds: how to define them without universal setpoints
Correct thresholds begin with crop sensitivity and phenological stage. In orchards, the same species tolerates very different conditions in dormancy versus bud swell versus bloom; in vegetables, the difference between seedlings and mature plants is large; in flowers, quality may be affected well before mortality. What to observe: when the first signs appear (discoloration, marginal necrosis, abortion) and which zone shows them first. A threshold is not only a minimum or maximum temperature, but also how long a zone stays beyond a limit.
Practical protocol: start with conservative thresholds per zone and adjust after 2–3 events using post-event checks. In a hypothetical frost setup, you might have an “attention” threshold and an “intervention” threshold, defined separately for the low pocket and the mid-zone. For heat, thresholds may be tied to maximum temperature and estimated VPD, but always validate with observations: if plants show stress before the threshold is reached, your threshold is too high or the sensor placement is wrong. After every adjustment, record the reason (symptoms, loss of turgor, leaf temperature).
5) Commissioning the system: data freshness, units, and plausibility tests
A data-driven workflow fails if data arrives late or in the wrong units. During commissioning, verify transmission interval, delays during critical periods (cold night, heat peak), and consistent units (°C vs °F, %RH, kPa for VPD). What to look for in charts: impossible “jumps,” values stuck at one number, or differences that are too large between two nearby sensors. These may indicate drift, poor radiation shielding, direct sun heating the sensor, or power/network issues rather than real microclimate differences.
Field plausibility test: use a reference thermometer (even a portable one) for spot comparisons, especially at sunset and before sunrise for frost, and at peak radiation for heat. You are not seeking perfect agreement, but confirmation of magnitude and trend. In platforms such as GrowGuard, also watch status/battery alerts so you do not confuse missing data with “everything is fine.” Practical decision: if your data is not fresh enough for reaction, change strategy—more forecast-based prevention and patrols, less waiting for a threshold crossing in live data.
6) Pre-frost protocol: what to do when risk becomes real
When the critical zone approaches your threshold, shift from monitoring to confirmation and action. What to observe: the cooling rate (degrees per hour or per minute) and proximity to dew point (high humidity suggests condensation/fog, which can slow cooling but complicate some interventions). Independent verification: a manual reading at the height of the sensitive organ (buds/flowers) and inspection of micro-relief (valley, forest edge, wind-sheltered spots). The practical decision is to prioritize zones: if resources are limited, protect the cold pocket first.
After intervention, check results using the same zone logic: did temperature rise in the critical zone, or only in the easier zone? Did you reduce the time spent below threshold, not just the minimum reached? In greenhouses, also check secondary effects: if local heating increased humidity and caused condensation on plants, note the need for air management next time. Post-event: assess symptoms at 24–72 hours (some injuries are delayed) and correlate them to the zone’s temperature history, not to a general farm average.
7) Pre-heat protocol: prevention, confirmation, and stress control
In heat waves, the key is not to wait for the peak. What to observe: morning temperature trend, rate of increase, and humidity drop; these tell you whether midday will exceed your ventilation/shading capacity. Independent verification: inspect plants in the “hot” zone before noon and measure, hypothetically, leaf temperature with an IR tool; if the leaf is far above air temperature, estimated VPD may underestimate real stress. Practical decision: trigger gradual measures (ventilation, shading, heat-load management) before plants lose turgor.
After interventions, do not look only at the day’s maximum; look at exposure duration and evening recovery. A zone that remains warm after sunset indicates thermal mass, poor circulation, or excessive insulation. Verify the result: do plants recover by evening? Did you reduce zone-to-zone differences, or just move the problem? In monitoring platforms such as GrowGuard, you can set different thresholds by zone for “peak” and for “duration,” then after the episode compare similar days (before/after) to see whether actions changed the curve shape, not just one point.
8) Post-event checks: audit, corrections, and learning for next season
Post-event checking is what turns data into a protocol. Mechanism: you identify the relationship between “what happened” and “what you measured,” then adjust thresholds, sensor placement, and action order. What to observe: where symptoms appeared first, which blocks lag behind, where fruits/inflorescences show defects. Independent verification: sample along transects (from low to high ground, or from door to tunnel center) and record symptom density, not just a yes/no observation.
Then return to the data: align symptom timing with temperature/humidity/estimated VPD intervals. If a zone shows “suspiciously good” values, investigate sensor shielding, position relative to drafts, or whether the sensor lost battery. If you also tracked EC/pH, specify the medium: for example, EC in fertigation solution does not directly explain root-zone stress unless you also measure in substrate/soil; they are different datasets. Practical decision: update zone thresholds and create an improvement list before the season (sensor relocations, freshness checks, patrol procedures). GrowGuard can help you keep zone history and share conclusions with the team, but effectiveness comes from disciplined auditing.
Conclusion
Frost and heat-wave protection is not about catching a magic number; it is about managing zone-based risk: forecast for preparation, properly commissioned sensors for confirmation, thresholds differentiated by microclimate, and post-event checks that continuously refine the protocol. When you separate mechanism, observation, and independent validation, you reduce both false alarms and late interventions.
If you want to operationalize this workflow with zone maps, alerts, and history in one place, you can use GrowGuard for monitoring and coordination, and then build the interventions in your own technical project (heating, shading, ventilation) separately from the app.