Fungal diseases don’t appear “out of nowhere”: they require a combination of humidity, temperature, time, and a source of inoculum. What you can control daily is the microclimate and the length of periods when leaves stay wet or when air sits near saturation. Good monitoring won’t tell you which pathogen you have, but it will show when conditions become conducive.
The problem on many farms is tracking one value in one place: an “average” temperature or a single relative humidity reading in a corner. In reality, risk builds by zones: near cold walls, under plastic, above irrigation lines, at row ends, or beside screens. Those are often the first places symptoms show up—and the same places where targeted interventions can work.
This guide explains the technical fundamentals (humidity, temperature, VPD, condensation, forecast), then a commissioning workflow: choosing suitable sensors, placing them by zone, verifying operation, setting alerts, and building a validation routine. At each stage you’ll see what to observe, what to verify independently in the crop, a practical decision you can take, and how to confirm whether it worked.
1) Start with the mechanism: conducive microclimate is not a confirmed disease
Fungi and molds need available water on plant surfaces or air that is close to saturated, plus temperatures that suit the species. In protected crops, that “water” is often a thin condensation film on the leaf, not rainfall. An air sensor shows when you are approaching saturation, and history shows how long you stayed there. Duration matters as much as peaks when you’re thinking about infection windows and repeated nightly events.
It’s essential to separate risk from diagnosis. Microclimate readings indicate conducive conditions, not the presence of a pathogen and not the cause of symptoms. Real sources of disease can include plant debris, planting material, irrigation water, or contaminated surfaces. In practice, you use data to schedule scouting and preventive actions, and you confirm problems through crop inspection and—when needed—professional plant health advice rather than treating the graph as proof.
2) What you are actually measuring: temperature, relative humidity, and VPD (with its limits)
Air temperature and relative humidity (RH) are the foundation, but you must interpret them together. High RH at a warm temperature is not the same as high RH at a cool temperature because air’s capacity to hold water vapor changes. VPD (vapor pressure deficit) combines temperature and RH and describes the “pull” the air can exert to take moisture from the leaf. Low VPD means air is near saturation and the risk of wet periods increases.
VPD calculated from air temperature and RH is an estimate; leaf temperature can differ (radiation, air movement, evaporation), which changes local condensation risk. During commissioning, look for correlations: when VPD drops, do you see droplets on film or a sheen on leaves in certain zones? Verify independently by direct observation at daybreak and after sunset: water gloss, droplets, damp smell, leaves sticking together, and differences between zones. Those are the field signals your calculations must match.
3) Sensor choices and units: prevent mix-ups that create bad alerts
For fungal-risk monitoring, the minimum technical set is an air temperature and RH sensor with reporting frequent enough to capture short events (especially evening-to-night transitions). You can then compute or display VPD for the same point. In houses where condensation is the main issue, value comes from detecting repeated “near-saturation” periods rather than chasing a single perfect number. What matters operationally is whether risky conditions accumulate, how often, and where.
Avoid mixing measurements. A temperature sensor does not measure EC or pH; those require dedicated probes. EC does not identify individual nutrients and depends on medium and method (water, fertigation solution, substrate extract, or bulk soil are different measurements). In a disease-risk workflow, EC/pH usually matter only indirectly (vigor, stress, canopy density), so don’t use them as a proxy for pathogens. Independent verification: compare fixed sensors with a handheld thermo-hygrometer in the same location and watch for persistent offsets.
4) Zone-based commissioning: choose the points where risk is “born”
“Risk by zone” means measuring where cool, humid microclimates form: near exterior walls, at row ends, under screens or shade cloth, above drip lines, near doors, or in areas with weak air circulation. In dense canopies (hypothetical example: trellised tomatoes with abundant foliage), the lower layer can behave differently from the top. A single “central” sensor may look safe while the crop interior sits near dew point for hours.
Start with a simple map and divide the space into 3–6 candidate zones: “cool,” “humid,” “central,” “ventilated,” and “perimeter.” Mount sensors at a height relevant to the foliage—away from direct fan blast and not pressed against plastic. Verify independently with short walk-throughs at key times (dawn and after dusk): note where air feels stagnant, where fine haze appears, and where droplets show on structure. Those are the zones where data should be strongest and decisions most targeted.
5) Data freshness and failure cases: when “high risk” is a measurement problem
Risk monitoring depends on fresh, consistent data. If reporting is delayed, you can miss short windows where RH rises quickly and then drops. During commissioning, verify the real transmission interval, what happens during network interruptions, and how the history looks (gaps, frozen values). A useful alert is not only “crossing a threshold” but “holding a condition for long enough.” Without continuous history, thresholds turn into noise and you lose the duration component that drives risk.
Common failure cases include: a sensor too close to a cold surface (exaggerated RH), a sensor in direct sun (inflated temperature, artificially high VPD), or direct exposure to fog/jet water (RH stuck at 99–100%). Independent verification is practical: temporarily move the sensor 1–2 meters, shield it from radiation, and see whether the profile changes; compare two nearby points. If risk “disappears” just by moving the sensor, the issue was placement, not crop reality.
6) Building alerts: thresholds, duration, time windows, and severity levels
Instead of searching for a “universal setpoint,” define thresholds based on your crop, structure, and your own history. Begin with simple alerts on high RH and low VPD, then tie them to duration (hypothetical example: the condition persists for a chosen number of minutes/hours) and to relevant time windows (evening–night–dawn, when condensation is most likely). Zone alerts are the key: the same night can be safe in the center and risky at the perimeter.
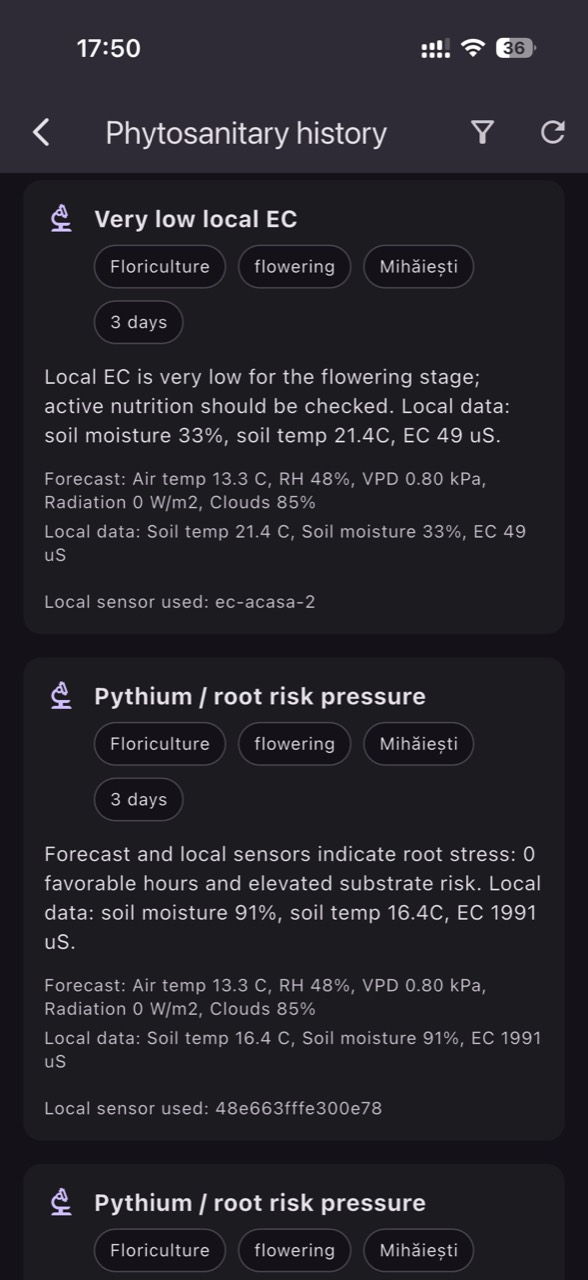
Decide in advance what action corresponds to an alert: targeted ventilation, increased air circulation, screen adjustments, avoiding irrigation events that increase humidity before night, or changing the routine that dries the canopy. After intervention, check the result in the data: does the duration of low-VPD periods drop? Do “near-saturation plateaus” shorten? In GrowGuard you can set temperature/humidity/VPD alerts by zone and then use history to confirm that the profile changed—not just the peak value.
7) Forecast as a planning tool: prevent risk windows instead of reacting to them
Forecast does not replace sensors, but it helps you plan when risk is likely to rise: evenings with rapid cooling, clear nights (radiative heat loss), humid periods after rain, or heat followed by a sudden drop. In open field, the combination of wet leaves (dew) and moderate temperatures can create repeated infection windows. In protected crops, the same pattern appears when warm daytime air cools at night and reaches its dew point on leaves and film.
The practical decision is to prepare a “drying window” before night (ventilation or moderate heating if available), schedule scouting in the morning specifically in zones where data shows risk, and time humidity-increasing work (washing, late irrigations, misting) into safer hours. Independent verification: after the forecasted night, look for condensation signs in the same zones and compare with zones that did not alert. If forecast suggested risk but sensors didn’t show wet periods, you learned something about your structure’s inertia and management.
8) A 14-day validation protocol: linking data, observations, and plant-health decisions
A short, repeatable protocol keeps you from “guessing” from two graphs. For 14 days, set: (1) a daily observation routine at two times (dawn and afternoon), (2) a list of risk zones and “control” zones, and (3) logging of operational events (venting, late irrigation, crop work). In parallel, track how many hours favorable conditions accumulate in each zone. You are not chasing perfection—you are looking for consistency and real differences between zones.
If symptoms appear (hypothetical: leaf spotting or mold on fruit), don’t automatically blame microclimate. Verify independently other possible sources: plant debris, excessive density, leaves touching soil, water on leaves from irrigation, or planting material issues. Microclimate indicates opportunity, not origin. The practical decision becomes more precise: local defoliation to increase air movement, schedule changes so foliage dries before night, plus a discussion with a consultant on measures compatible with your program. Verify outcome by reduced risk duration and by field checks: less condensation, faster canopy drying, and symptoms not advancing in that zone.
Conclusion
Monitoring fungal disease risk without guessing means treating microclimate as a measurable process: temperature, humidity, and VPD tracked by zone and interpreted with duration, not only thresholds. When commissioning is done correctly, alerts become a short action list: where to check, what to adjust, and what to confirm the next day in both the data and the crop.
If you want to implement a zone workflow quickly, a platform such as GrowGuard can help you view critical points at once, receive alerts, and connect history to farm events. Start with 2–4 zones, validate for 14 days, then expand only where the differences are real.