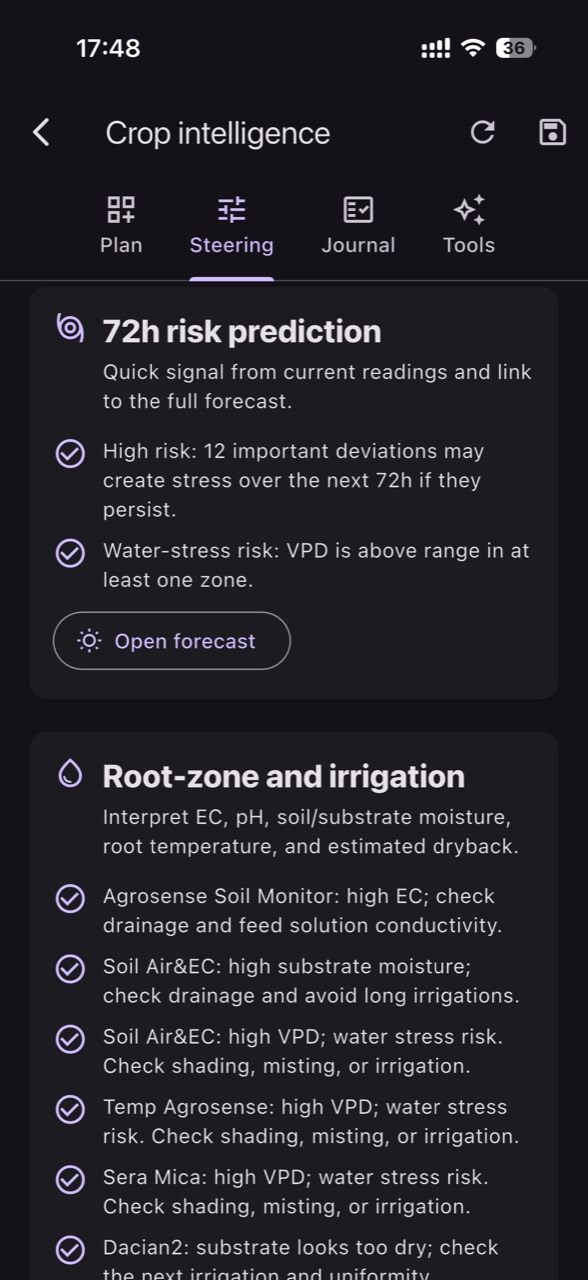
Greenhouse and tunnel cucumbers build canopy fast, and their large leaves pull water aggressively as light and temperature rise. That speed is why water stress can show earlier than in many vegetables: a delay of only a few hours between plant demand and irrigation may show up as midday droop, flower loss, or misshapen fruit. Control starts by understanding transpiration.
In protected cultivation, water demand is not set by a calendar but by the moving combination of radiation, temperature, humidity, and ventilation. “Closed” air can suppress transpiration yet increase condensation and wet-leaf periods, while an overly high VPD can push transpiration beyond what roots can supply. Sensors help you connect cause to effect instead of reacting to symptoms.
The practical key is to combine two kinds of information: what the plant is likely “asking for” (from climate indicators) and what is actually happening in the root zone (moisture, temperature, and EC/pH measured in the correct medium). From there you can build useful alerts and a verification routine: what to confirm independently, what to adjust in irrigation/fertigation, and how to prove the change worked.
1) Transpiration: the mechanism behind peak water-use hours
Transpiration is the water flow moving up through the plant and out through stomata, driven by drier air and the energy of light. In cucumbers, large leaf area and rapid growth make changes in radiation and ventilation show up quickly in water use. When air dries suddenly (VPD rises), the plant can lose water faster and roots must compensate. If they cannot, stress can appear even when the surface looks moist.
What to observe in practice: the slope of root-zone moisture decline after sunrise, the “race” between demand and recovery after irrigations, and periods when leaves stay wet (condensation or fog) even though transpiration is low. Verify independently with a crop walk: slight midday wilting, temperature differences between canopy top and base, or persistent droplets. Decision: adjust irrigation frequency to the day’s dynamics, then check results by how quickly moisture returns toward your target level and whether plants remain stable during peak hours.
2) Water demand: translating climate into action without universal recipes
In greenhouses, demand changes hour-by-hour, not only week-by-week. A robust protocol begins with measuring air temperature and humidity in representative zones and converting them into an estimated VPD. VPD is derived from air temperature and relative humidity, but it remains an approximation: leaf temperature can differ, especially under strong radiation or in windy spots. Treat VPD as a trend signal and always correlate it with root-zone response.
What to track: when VPD climbs, does root-zone moisture drop faster? If yes, that is a signal that irrigation must anticipate the peak rather than “repair” it later. Independent verification can be as simple as checking sector flow and uniformity (drippers, pressure, filters). Decision: split the day into windows (morning, peak, afternoon) and adjust pulse density by window. Check the outcome by fewer sudden moisture “crashes” and by avoiding large EC swings in drainage where drainage exists.
3) Root-zone readings: choosing the sensor and knowing what it truly measures
For irrigation and fertigation you need readings from the actual root medium: soil, coco, peat mixes, rockwool, and so on. Volumetric water content (VWC) sensors and tension-based sensors (matric potential) behave differently: VWC reads as a volume/percentage proxy, while tension reflects how hard roots must pull to extract water. In substrates, a “good” value depends on material, density, and salinity. Commissioning therefore means tying readings to crop behavior, not copying thresholds from another site.
What to observe: after an irrigation pulse, moisture should rise quickly and then decline gradually; a very steep decline can mean high demand or roots concentrated near the sensor, while a slow or weak rise can indicate insufficient flow or poor distribution. Verify independently with a physical check at rooting depth (not the surface) and with a quick uniformity check along rows. Decision: adjust sensor position (closer to the active root zone) or adjust pulse pattern. Confirm success when curves become repeatable day-to-day under similar weather.
4) Sensor placement in cucumber houses: dense canopy, entrances, and row ends
Cucumber microclimate can differ sharply within the same structure: near doors and vents, at row ends, or under very dense foliage. Drip systems can also show small pressure differences along length. That is why a single measurement point can seriously mislead you, even if the sensor is working perfectly. A placement plan should include at least one representative zone and one “problem” zone (for example, near an entrance or in a cooler corner).
What to observe: zone-to-zone differences in temperature/humidity, longer wet-leaf periods in cooler zones, and different root-zone drying speeds. Verify independently with short walks at key hours (early morning and around midday) and note where you feel drafts or stagnant air. Decision: reposition so one sensor sits in the “decision zone” (most plants) and another acts as an early warning in a fast-changing zone. The check is practical: alerts become less frequent but more relevant, and you can explain them with zone context.
5) Pulse irrigation: reading the curves and avoiding low-oxygen root conditions
Cucumbers often respond well to short irrigation pulses because water availability stays steady without saturating the root zone for long. However, too many pulses or excessively long pulses can reduce oxygenation, especially in heavier soils or compacted substrates. Sensors help you see whether moisture stays too high for too long after irrigation or, on the opposite side, drops too quickly. That view is more reliable than judging by the surface appearance of the medium.
What to observe: recovery time after irrigation and the “baseline” moisture level reached before the next pulse. If the baseline creeps upward day after day, you may be accumulating water in the profile; if it trends downward, a deficit may be developing. Verify independently through drainage observation (when available) or manual checks for aeration problems (odor, browning roots). Decision: change either the interval between pulses or the volume per pulse—avoid changing both at once. Confirm the result when the curve stabilizes and plants show neither midday droop nor signs consistent with root suffocation.
6) Fertigation and EC: different measurements, different interpretations
EC measures total soluble salts, not a nutrient “recipe.” Critically, EC of source water, fertigation solution, substrate extract, and bulk soil are different measurements and should not be compared as absolute values. On-site pH/EC monitoring complements laboratory water analysis, but does not replace it, especially when you need to understand alkalinity and longer-term water behavior. Use dedicated EC and pH probes; a temperature sensor cannot measure EC or pH.
What to observe: if root-zone EC or drainage EC (where drainage exists) rises on high transpiration days, salts may be concentrating; if EC drops abruptly, you may have dilution (excess irrigation) or a recipe change. Verify independently with a calibrated portable EC meter and correctly collected samples from the relevant medium (for example, solution from the irrigation line versus drainage). Decision: adjust the water-to-fertilizer ratio or introduce controlled leaching only after confirming you are measuring the same medium consistently. Check results by improved day-to-day EC stability under similar conditions, rather than chasing a single number.
7) Useful alerts: thresholds built on dynamics, not only on numbers
Effective alerts catch deviation early and push you to check a likely cause. In cucumbers, a fixed moisture threshold can trigger too often because water demand changes rapidly with weather and leaf mass. More useful alerts are based on rate of change (for example, “moisture is dropping unusually fast within an hour”) and on differences between zones (“Sector A is drying much faster than Sector B”). This framing turns alerts into diagnosis, not noise.
What to observe: repeated alarms in the same sector can point to clogging, pressure differences, a sensor placed outside the active root zone, or a harsher microclimate. Verify independently: visual inspection of drippers, quick line flow checks, and a fast sensor contact check (probe firmly seated in the medium). Decision: treat every alert as a diagnostic ticket rather than an automatic command. In GrowGuard, zone-based alerts and the sensor map help you judge quickly whether the issue is local or general. Validate by seeing the zone gap disappear after intervention and curve stability return within 24–48 hours.
8) Fresh data and common error modes: avoiding wrong decisions from “correct” readings
In irrigation control, data freshness matters: delayed or infrequent readings can miss the midday demand peak entirely. Set a sampling interval that captures the dynamics (denser during active hours) and routinely check for gaps, low batteries, or signal losses. Another common failure mode is drift: a sensor can slowly slide in value without a sudden obvious fault. That is why a scheduled field-verification routine is as important as the dashboard.
What to observe: unexplained jumps, suspiciously perfect flat lines for too long, or identical values from two sensors in different places. Verify independently with a simple test: water locally around the sensor and confirm it responds within a reasonable time; for EC/pH, check against standard solutions and record the calibration date. Decision: if measurement quality is suspect, do not change irrigation or fertigation recipes until you confirm. In a hypothetical case where a sector reads “dry” only on the sensor but plants are turgid and the medium is moist, treat the reading as questionable. The result is fewer unnecessary interventions and stronger trust in the data.
Conclusion
Managing transpiration, irrigation, and fertigation in greenhouse cucumbers comes back to one simple idea: plant demand shows up in the climate, and the real response shows up in the root zone. When you connect VPD (as an estimate), moisture curves, and EC/pH checks taken from the correct medium, you reduce both deficit stress and the risks of salinity concentration or low-oxygen root conditions. The difference is verification discipline, not a “perfect” setpoint.
To turn readings into repeatable decisions, build alerts around dynamics and zone differences, then validate every intervention by its effect on curves and on the crop. Platforms such as GrowGuard can centralize zone history and alerts so a team reacts consistently. For a fast start, define two zones, install two root-zone measurement points, and agree on a field confirmation step before any major irrigation or fertigation change.