In greenhouses, eggplants respond quickly to the microclimate, but the true rhythm of the crop is often decided in the root zone. That is why one of the most common confusions appears: high transpiration demand in the canopy, but cold or weakly active roots. On those days, watering “by the air” can slow production—or, in the opposite direction, unnecessarily load the substrate.
In practice, two batches under the same air temperature can require different irrigation simply because soil/substrate temperature differs after a cold night, after cold irrigation water, or due to position inside the house. If you do not measure the root zone, you will misread signals: slight midday wilting can mean thirst, but it can just as well indicate “lazy” roots in a cold or hypoxic medium.
The article below links root-zone conditions (temperature and moisture) directly to irrigation timing and to stress interpretation. For each situation you get: mechanism, what to observe, what to verify independently, a practical decision, and how to check the result. The central idea is simple: air and roots can tell different stories, and good irrigation starts with correct readings and repeatable checks.
1) Why root-zone temperature completely changes the “need for water”
Root-zone temperature directly influences root activity: uptake of water, oxygen, and salts depends on metabolism, membrane permeability, and the development of absorbing root hairs. When soil/substrate is cooler than you expect (often after cold nights), the leaf may still be driven to transpire, but the root system delivers water more slowly. The result can look like drought stress, yet the correct response is not always “more water.”
What to observe—and how to standardize it: choose the same daily window (for example 11:30–13:30) and follow the same 10 reference plants (same positions in the greenhouse). Record two markers: the midday wilting amplitude and recovery 60–90 minutes after radiation drops or after a small irrigation pulse. Independent verification: measure soil/substrate temperature near the dripper and between drippers, and compare it with canopy-level air temperature. Decision: if roots are cold and recovery after a pulse is weak, prioritize microclimate/root-zone warming management and smaller pulses rather than filling the profile. Check the result by trend: over 24–48 hours, midday wilting should decrease and root-zone moisture should return to a rhythm (drying between pulses).
2) “Soft leaf” vs “hard leaf”: avoid diagnosis by impression
In eggplants, casual language (“stiff leaves,” “soft leaves”) can mislead unless you define what you are seeing. “Hard” may mean turgid (water-filled tissue, leaves held up) or “leathery” (thickened tissue, sometimes with more closed stomata, often linked to cumulative stress). “Soft” may mean transient midday droop or a lack of turgor already in the morning. Without standardization, two operators can make opposite decisions from the same image.
A practical observation protocol: check early morning (before strong heating) and at midday. In the morning, a leaf with a firm petiole and a flat blade suggests good turgor; if leaves are already drooping in the morning, you have a stronger signal of a root-zone problem (too little moisture, local salinity, or compromised roots). Independent checks: (1) moisture at two root-relevant depths; (2) EC in the fertigation solution versus EC measured in a substrate/soil extract (different media, therefore different values). Decision: when the symptom is present in the morning, treat it as a priority diagnostic case (water/EC/temperature/oxygen). Check the result using “recovery time”: after correction, the next morning should be visibly more turgid on the same reference plants.
3) Substrate/soil moisture: not just “how much,” but also “how it drops”
In greenhouses, many problems come from moisture dynamics, not from a single value. With eggplants, a root zone that stays constantly too wet can reduce oxygenation and slow uptake, even if the plant “seems” to ask for water at midday. Conversely, a profile that dries abruptly between rare, large irrigations can create strong swings of stress and recovery, affecting fruit set and quality. That is why you track the drying slope between irrigations, not only a minimum threshold.
What to measure: moisture sensors (volumetric or tensiometric, depending on the medium) installed to capture both the wet zone near drip and the edge of that wet bulb. Independent verification: a manual distribution check (for example, periodically opening a reference pot or inspecting a profile section) and checking dripper flow at representative points to rule out clogging. Decision: if moisture rises after each pulse but then does not return (no measurable drop) within a timeframe that is reasonable for your system, reduce pulse duration or increase the interval to restore aeration. Check the result with a clear sign: after adjustment, you should see a consistent drop between pulses, not an almost flat “plateau.”
4) When the air demands water but roots cannot: avoiding overwatering
High-radiation days with high VPD increase transpiration demand, yet if the root zone is cold or too wet, the plant cannot sustain the flow. This is where the trap appears: the operator sees midday wilt and adds water, but the root limitation remains, and excess moisture prolongs the problem. Instead of chasing wilt with volume, follow whether pulses produce a real response in the plant and in the moisture profile.
Standardized observation: on the same reference plants, note midday wilting and check recovery 30–60 minutes after a short pulse (not after a large irrigation). Independent checks: root-zone temperature and the difference between moisture near the dripper and at the wet-bulb edge; if the edge stays dry, you may have too little volume per pulse or uneven distribution. Decision: in “dry air, limited roots” situations, prefer short, more frequent pulses—just enough to stabilize flow without suffocating roots—while addressing the cause in parallel (local warming, aeration, drainage). Check the result with two signs: lower wilting amplitude and the return of a drying slope between pulses.
5) Leaf temperature: only useful if you measure it, not if you assume it
It is tempting to say “the leaf is hotter” when the plant looks stressed, but without a concrete measurement the statement does not help a decision. In a greenhouse, leaf temperature can differ from air temperature due to transpiration, airflow, and radiation; therefore, VPD calculated from air temperature and relative humidity remains an estimate, not a leaf measurement. If you want to link irrigation to the plant’s real response, you need an objective, repeatable verification.
A practical check (hypothetical, but applicable): use a spot IR thermometer or a thermal camera and always measure the same leaf (similar position and exposure) at the same hours, avoiding reflections and glossy surfaces. Compare leaf temperature to the air right next to it; persistent differences correlated with high VPD can indicate reduced transpiration or a limited flow. Decision: if the leaf stays consistently warmer than the air at peak hours while root-zone moisture is adequate, do not automatically “add water”; investigate the limitation (cold roots, high EC in the root zone, flow problems, compaction). Check the result by tracking whether the leaf–air difference narrows under similar climate conditions after correction.
6) Measurable start/stop criteria for irrigation: beyond “it seems too wet”
An operational decision needs criteria you can verify on a graph, not only by perception. In substrate, a robust indicator is the post-pulse response: after irrigation, moisture should rise and then begin to fall within a time window you define (based on your greenhouse history). If, after multiple pulses, the sensor shows accumulation (peaks progressively higher) with no decline between them, you have a sign of persistent excess. In soil the logic is similar, but slower; the slope still matters more than a single number.
How to make it measurable: define two internal “bands” based on the last 7–14 stable days: (1) a moisture band where the crop performs well (good observations, steady growth), and (2) an upper band above which you previously observed slowing or hypoxia-type symptoms. Do not impose universal values; set them from your own data and confirm by inspecting roots and checking for anaerobic smell at reference points. Start decision: when moisture at the active depth drifts toward the lower band and drying accelerates during light hours. Stop decision: when after the last pulse moisture no longer falls for a chosen interval (for example, a few daytime hours) or when deeper sensors begin to rise steadily, indicating percolation. Check the result via a weekly audit: compare curves before/after and verify that accumulation decreased without increasing midday wilting.
7) EC and moisture: separating “thirst” from osmotic stress in the root zone
In eggplants, leaves can look water-deficient even when water is present, but “hard to absorb” because of local salinity (osmotic stress). Here, EC measurement must be interpreted correctly because EC in the fertigation solution is not the same as EC in the root zone. You can have a “normal” inlet solution and still get accumulation in substrate/soil if evaporation is high, drainage is insufficient, or pulses are too small to push salts away from the main root activity zone.
What to verify independently: measure pH/EC with dedicated probes in the irrigation solution and, separately, evaluate EC in the growing medium using an extract method appropriate to your substrate/soil. Do not try to infer individual nutrients from EC: EC only indicates total dissolved salts. Decision: if you see midday wilting with apparently sufficient moisture and you have signs of salt accumulation in the root zone, adjust irrigation strategy to avoid concentration (pulses that wet uniformly without ponding) and check source water through periodic analysis; on-site pH/EC monitoring complements the lab, it does not replace it. Check the result by trend: after changes, extract EC should move back toward your functional level and the plant should recover faster during peak demand.
8) Commissioning sensors and zone differences: so you don’t irrigate by “different stories”
In greenhouses, wrong sensor placement creates wrong decisions—especially for eggplants, where roots react strongly to cold and excess water. You need sensors in the root zone and in the canopy because air and roots can evolve differently. A classic failure: reading air temperature as a proxy for soil temperature in spring; then watering “like summer” and ending up with a cold, saturated profile. Another failure: a sensor placed too close to a dripper always reads “perfect,” while the wet-bulb edge stays dry.
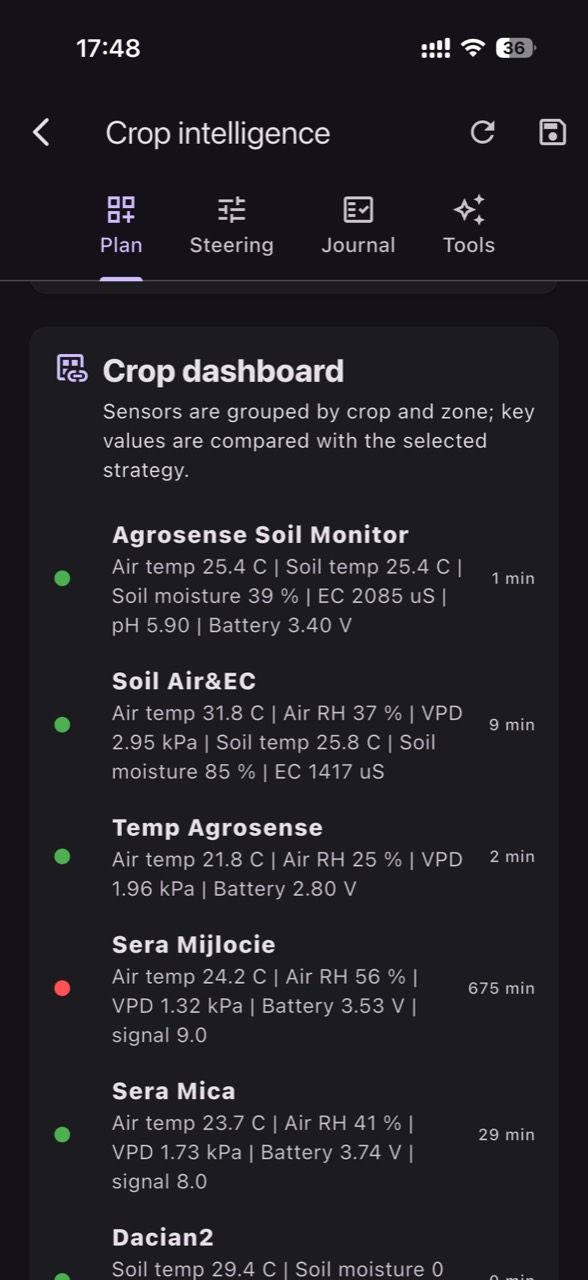
A short commissioning protocol: (1) verify units and reporting interval (data that are hours old can trigger unnecessary watering); (2) run a pulse test: start a short irrigation and see whether the moisture sensor responds promptly (if not, it may be too far, poorly installed, or you may have a local irrigation fault); (3) compare two points in the same zone to detect microclimate/irrigation non-uniformity; (4) after 7 days, adjust placement if you do not see the normal rise–fall alternation. A platform such as GrowGuard can help you view zone differences and set trend-based alerts, but good decisions still depend on greenhouse verification: flow, distribution, roots, and soil temperature.
Conclusion
For greenhouse eggplants, irrigation timing is not decided only from “how the plant looks” or from air temperature. Root-zone temperature and the moisture dynamics of the profile tell you whether roots can support transpiration, or whether you are approaching hypoxia or salt accumulation. The key is to turn impressions into standardized observations and always confirm with an independent measurement: soil/substrate temperature, moisture in two points, and—when needed—EC measured in the correct medium.
Build your thresholds from your own history (not from templates), then verify the effect of every change: the drying slope between pulses, plant recovery after peak demand, and uniformity across zones. If you want to centralize these data and compare zones without being misled by microclimates, you can use GrowGuard for monitoring and alerts; start with a reference zone and adjust only after you confirm in the crop.