Reducing greenhouse energy costs doesn’t mean randomly “cutting” temperature. It means shrinking losses and avoiding short heating–venting cycles that burn fuel. The crop quickly pays for aggressive savings: leaf condensation, slowed growth, flower abortion, or greater disease sensitivity. The key is threshold-based control and effect verification, not assumptions.
In a greenhouse, energy is lost through the envelope, through unplanned air exchange, and through decisions made after the problem already exists (for example, hard heating after a night that ran too cold). But “savings” can also create hidden costs: if heating is reduced too much, humidity rises, VPD falls, transpiration stalls, and plants remain “cold” and vulnerable. That’s why you need correct, fresh measurements interpreted in context.
The article below explains the mechanisms, what to watch in real time, what to verify independently (so you’re not relying on a single sensor), what practical decision to take, and how to check the result in the history. The protocol applies to vegetables, flowers, or seedlings, with adaptation to species and growth stage: temperature needs and humidity tolerance differ between, for example, fruiting tomatoes and fast-growing lettuce.
1) Define “crop risk” before you define “savings”
Start by stating what you cannot afford to compromise for your specific crop: minimum temperatures that slow development, humidity that creates condensation and fungal risk, or large day/night swings that affect quality. The mechanism is straightforward: the plant responds to available energy and to vapor pressure deficit; if air is too humid and too cool, transpiration drops, calcium uptake becomes unstable, and leaves stay wet longer.
What to observe: air temperature, relative humidity, VPD (estimated from air temperature and RH), plus crop signs (turgor, marginal burn, flower drop, morning droplets on leaves). What to verify independently: a reference thermometer for air, visual checks for condensation at sunrise, and if needed leaf temperature with an IR thermometer (the difference from air can matter). Practical decision: set phase-based objectives (for example, “no morning leaf condensation” as an operational target). Result check: compare mornings in the history with observed condensation and growth uniformity.
2) Energy is lost in oscillations: avoid heating–venting “ping-pong”
A common driver of high costs is reactive control: you heat until it “seems OK,” then vent aggressively to cut humidity—throwing out the warm air you just paid for. Mechanism: warm air can hold more water; if you heat without managing moisture removal, RH may remain high, and when vents open you lose enthalpy (heat) and CO₂. Short cycling also increases equipment wear.
What to observe: how often heating starts, ventilation openings (even if manual—write them down), rapid jumps in temperature and RH. What to verify independently: confirm the thermostat/control probe position is correct (not near a heater, not in a draft). Practical decision: introduce hysteresis and sequencing: first correct temperature gently, then apply a sustained minimal venting/dehumidification approach instead of a “shock” opening. Result check: in the history, look for lower oscillation amplitude and fewer RH spikes.
3) Ventilation: when it saves money and when it makes you pay more
Ventilation is the main tool for humidity and temperature control, but it can also be your most expensive “loss” if used without criteria. Mechanism: when outside air is cold and dry, small ventilation can remove a lot of water (effective dehumidification) but brings in cold air that must be reheated. When outside air is warm and humid, ventilation reduces RH slowly and may overheat the crop.
What to observe: the inside–outside difference (temperature and RH), condensation on structure, and the time leaves take to dry after irrigation or after night. What to verify independently: compare an indoor sensor with an outdoor one so you don’t assume “it’s dry outside.” Practical decision: set action thresholds based on risk (condensation, persistently high RH) and opportunity (when outside air can actually dehumidify). Result check: document a hypothetical action (“vented 10 minutes at sunrise”) and confirm in the history that RH dropped without falling below a crop-critical temperature.
4) Heating: use it as a humidity-control tool, not only a temperature tool
Heating can reduce RH indirectly by increasing the air’s vapor-holding capacity. But if you use heating alone, without removing moisture, you only raise temperature above wet air—and when it cools you return to condensation. The correct combined mechanism is: moderate heating to shift the dew-point relationship, followed by sustained minimal ventilation (or a dehumidification mode) to physically remove water from the greenhouse.
What to observe: night and sunrise are the key windows. Track whether temperature drops into the zone where dew forms on leaves and whether RH sits very high for hours. What to verify independently: spot-check condensation on film/glass and on leaves; don’t confuse “no fog” with “no condensation.” Practical decision: plan a repeatable morning “drying window” (a short sequence), instead of heating hard later as a rescue. Result check: in the history look for mornings with declining RH and stable temperature, plus fewer hours of wet foliage conditions.
5) Thresholds and alerts: how to set them without forcing universal setpoints
Useful thresholds aren’t “recipes.” They are operational limits adapted to crop, stage, and infrastructure. Mechanism: the same air temperature can be acceptable in vegetative growth but risky in flowering; the same RH can be tolerated when leaves are warm, but becomes dangerous when leaf temperature runs below air temperature. That’s why thresholds should be tied to context: “if RH stays high for X time” or “if VPD stays too low for Y hours.”
What to observe: duration of exceedance, not only the instantaneous value; a short spike can be harmless, while an entire night of high RH is different. What to verify independently: confirm units and measurement method; VPD is an estimate from air temperature and RH, and leaf temperature can differ. Practical decision: start with conservative thresholds, then adjust after 2–3 weeks of history and crop guidance (without fixing universally valid numbers). Result check: see whether alerts coincide with real problems (condensation, slowed growth) and reduce “false alarms” by adding time conditions.
6) Sensors and commissioning: if you measure wrong, you “save” wrong
Energy reduction depends on fresh, comparable data. Mechanism of errors: a temperature sensor in an air jet or near a hot pipe “sees” a different reality; a dirty humidity sensor can overestimate RH; large data delays force late reactions that cost more energy. Use dedicated sensors for temperature and humidity; a temperature sensor does not measure EC or pH, and those require dedicated probes for their specific medium.
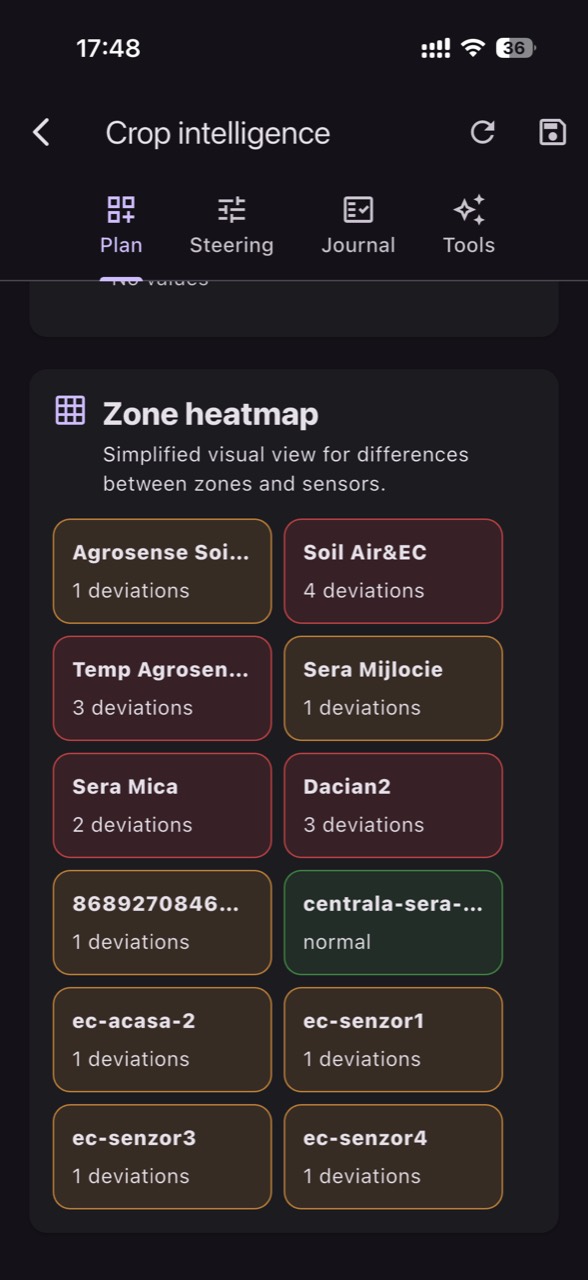
What to observe: data freshness (how often readings update), stuck values, and unrealistic jumps. What to verify independently: a spot check with a portable instrument, plus a comparison between two greenhouse points (microclimates). Practical decision: commission in three steps: verify placement (near canopy height, shielded from direct radiation), verify coherence (logical differences by zone), then set alerts only after 7–14 days of history. In GrowGuard, use crop zones so you don’t mix a cold end with the greenhouse center—and so you can see where energy is “escaping.”
7) History: turn “I think” into “you can see it” (and correct the method)
History is what tells you whether savings are real or whether you just moved the problem. Mechanism: when you reduce heating, secondary effects show up in RH, VPD, and condensation. When you change ventilation, you see how quickly the climate stabilizes and how much it differs between zones. Without history, you operate on impressions—and impressions are biased by extreme days rather than trends.
What to observe: compare similar periods (for example, three nights with comparable weather) before and after a change. Track hours of very high RH, temperature amplitude, and slopes (how fast it cools after sunset). What to verify independently: correlate sensor curves with operational notes (when you vented, when heating started). Practical decision: keep changes small and reversible, one variable at a time (for example, only the morning sequence). Result check: if time spent in risky conditions decreases without visible crop slowdown, keep the setting; if not, revert and adjust.
8) A commissioning workflow for safe savings (hypothetical example)
A practical, repeatable workflow starts with a one-week baseline: measure without aggressive optimization and simply record how you operate. Then choose one target—for example, reducing morning heating–venting cycles. Working mechanism: define time-conditioned thresholds (not instant triggers), choose one action (sustained minimal venting or moderate heat before venting), and evaluate the effect in the same time window for 3–5 consecutive days.
What to observe: in the hypothetical scenario, after introducing a sunrise “drying window,” track whether RH declines more smoothly and whether temperature avoids abrupt drops into a species-sensitive zone. What to verify independently: check leaves 1–2 hours after sunrise (are they dry?) and compare colder and warmer zones. Practical decision: only after a good outcome do you adjust a second element (for example, a different night threshold). Result check: in GrowGuard you can quickly compare zone histories and set alerts that confirm the change creates a more stable climate—not merely a colder one.
Conclusion
Reducing greenhouse energy costs becomes “safe” when you work with risk-linked thresholds instead of universal setpoints, and when you continuously check side effects: condensation, long hours of high humidity, too-low VPD, and large day/night swings. Ventilation and heating aren’t opposites; together they can remove water from the greenhouse with less energy than late, abrupt interventions.
With correctly commissioned sensors, fresh data, and zone-based history, optimization becomes a process: change a little, observe, verify independently, and keep only what works. If you want a structured way to manage thresholds, alerts, and zone comparisons, GrowGuard can support monitoring and analysis—while the final decision remains an agronomic protocol adapted to your crop.