In greenhouses and tunnels, the same crop can effectively “live” in several microclimates: near doors, under vents, at the ends, along cold walls, in denser rows, or in areas with different irrigation behavior. That’s why sensors sometimes flag a deviation and the team reacts—when the real issue is only sensor placement or how the values are interpreted.
A useful diagnostic guide starts from a simple question: does the reading explain what is happening in the plant, or does it mostly describe the sensor’s immediate surroundings? A temperature sensor mounted too high can report “heat” while the canopy is under cold stress; a substrate-moisture probe placed next to a dripper can show “wet” even if the rest of the zone is dry.
Below is a practical protocol for turning data into decisions without “false alarms”: how to choose measurement points, how to define crop zones, and how to compare microclimates to separate a real fault (ventilation, heating, irrigation, nutrients) from a misleading reading. The focus is on mechanism, independent checks, and confirming results after intervention.
1) Start with the right question: “What volume does this sensor represent?”
Mechanism: every sensor measures locally. In protected cropping, gradients are large vertically (soil–leaf–upper air) and horizontally (ends versus center). If a single point is treated as “the greenhouse average,” confusion follows: a temperature spike next to sun-warmed film can mimic a heating issue, and high humidity in a corner can mimic a “too-humid greenhouse.”
What to observe and verify: before changing settings or switching equipment on, look at context—sensor position, height relative to the canopy, proximity to doors/vents/fans, and whether it is shaded or in direct sun. Verify independently with a manual reading in 2–3 points and crop observations (condensation, limp leaves, scorched edges). Practical decision: explicitly define what the point represents (e.g., “north-end zone, at leaf level”). Check the result: after repositioning or zoning, differences between points should become explainable, not random.
2) Air sensor placement: height, shielding, and radiation effects
Mechanism: air temperature and humidity at leaf level drive transpiration, stress, and condensation risk. A sensor exposed to direct radiation or mounted next to heated metal/film can read warmer than the true air. Conversely, near a cold wall or an air stream, it can read colder and drier. These errors propagate into VPD, which is calculated from temperature and humidity rather than measured directly.
What to observe and verify: when midday jumps appear or large differences show up on otherwise similar days, check whether the sensor is shielded and naturally ventilated, not sunlit or pressed against structure. Compare with a second point at the same height inside the foliage mass, and track whether trends are coherent (not just the absolute values). Practical decision: move the sensor to the representative canopy level for that zone and avoid “extreme points” unless you specifically want to monitor those extremes. Check the result: after 24–48 hours, curves should be steadier and better correlated with observable phenomena (morning condensation, drying after venting).
3) The crop zone as the unit of truth: why “one sensor per house” is not enough
Mechanism: crop zones emerge from infrastructure (irrigation sectors, heating lines, screens, vents), geometry (ends, alleys, height differences), and biology (density, growth stage, cultivar). If you use a single reading for everything, you will “treat” a local problem as if it were uniform—or you will miss a real issue that happens only in one sector. Good diagnostics compare zones that should behave similarly.
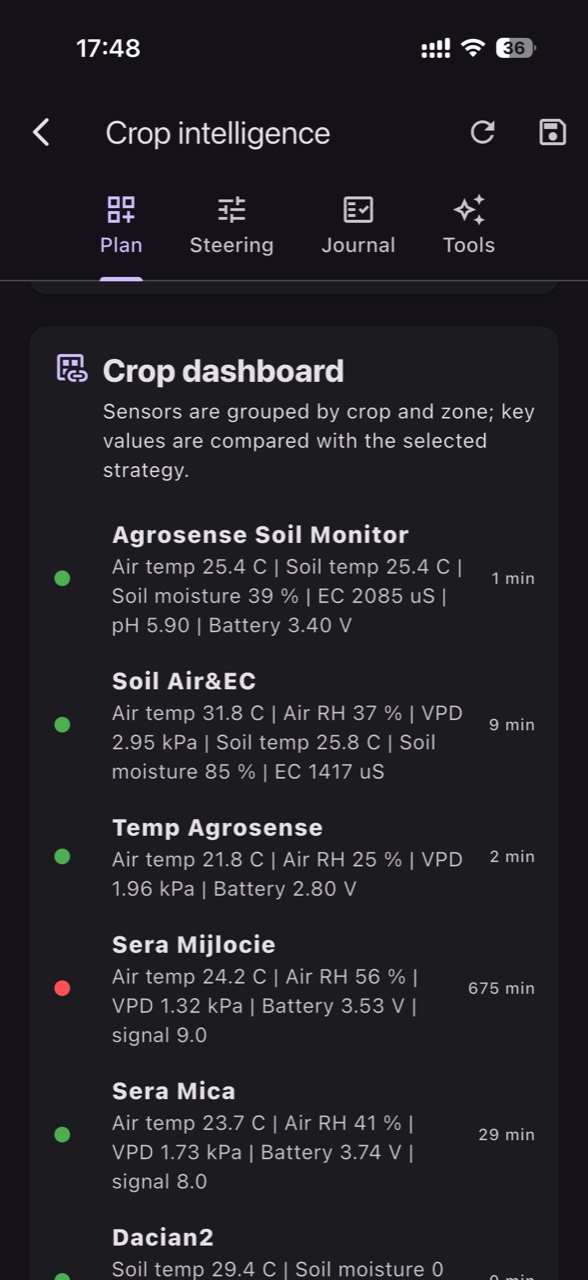
What to observe and verify: define, hypothetically, 3–6 zones with agronomic logic (e.g., “near door,” “under vent,” “middle,” “along wall,” “irrigation sector A/B”). Install a reference air point in each and, where relevant, a soil/substrate point. In GrowGuard, the sensor map and crop zones help you see whether a difference is structural (always the same zone) or episodic (only under certain conditions). Practical decision: set thresholds and alerts by zone, not by greenhouse. Check the result: after an intervention (ventilation, heating, schedule change), the affected zone should improve without degrading the rest.
4) Soil/substrate sensors: wrong placement mimics “drought” or “overwatering”
Mechanism: root-zone moisture is heterogeneous, especially with drip irrigation. A probe installed too close to the dripper reads constantly wet; one placed between two lines or too close to the edge may read dry even when plants are fine. Depth matters: in substrate, the upper layer dries quickly; in soil, deeper layers respond with delay. For this reason, “hours of irrigation” do not automatically translate into “correct moisture.”
What to observe and verify: when the sensor shows “dry” but plants are turgid, check moisture manually in several points (feel, a simple probe, inspection of the substrate plug), plus irrigation uniformity (flow, pressure, emitters). When it shows “too wet” but plants wilt at midday, suspect placement next to the dripper or a local drainage issue. Practical decision: reposition the probe in a representative root volume and document distance from the dripper and depth. Check the result: after 2–3 irrigation cycles, the curve should show plausible rises and falls, and crop observations should align.
5) Compare microclimates to find equipment faults—not “plant problems”
Mechanism: many symptoms (leaf curling, wilting, flower abortion, spotting) can be triggered by short episodes of thermal or water stress. If you have two sensors in nearby zones and one shows repeated episodes of low temperature or high humidity, the cause may be a vent that drafts on one side, a screen that doesn’t close fully, or a fan that circulates unevenly. Zone comparison turns suspicion into a testable hypothesis.
What to observe and verify: look for persistent differences between zones at key times—morning (condensation), after vents open, after heating starts, during irrigation. Independently check equipment: actual damper position, air currents, temperature on structure, and local condensation. Practical decision: intervene in a targeted way (vent adjustment, door sealing, circulation rebalance), not “globally.” Check the result: in the next days with similar conditions, the zone-to-zone difference should shrink, and new symptoms should stop appearing in that same zone.
6) VPD and “high humidity”: when the number scares you but the mechanism is different
Mechanism: VPD is an estimate calculated from air temperature and relative humidity; the leaf can be at a different temperature than the air, especially under strong radiation or evaporative cooling. As a result, an “unfavorable” VPD can appear even when plants look fine—or the reverse. High relative humidity at night can be normal, but becomes problematic when it combines with cold surfaces and long leaf-wetness periods.
What to observe and verify: when you receive “high humidity” alerts or low VPD alerts, check whether there is real condensation on leaves/film and whether stagnant-air zones exist. Compare microclimates: if only one zone runs high humidity, suspect circulation or surface-temperature differences. Practical decision: adjust air management (short ventilation, recirculation, heating to raise surface temperatures) in the problematic zone rather than simply trying to “lower humidity” in general. Check the result: track shorter high-humidity duration and less condensation, plus the evolution of symptoms compatible with disease (without confusing risk alerts with detection of the pathogen itself).
7) EC and pH: same abbreviations, different media, different conclusions
Mechanism: EC (salinity/soluble salts in solution) and pH are measurements that depend on the medium and the method. EC in source water is not the same as EC in fertigation solution, and EC from a substrate extract is not the same as EC in bulk soil. A poorly labeled reading (“high EC”) can trigger the wrong reaction. Important: air temperature/humidity do not “infer” EC/pH; you need dedicated probes and a consistent sampling or measurement method.
What to observe and verify: when EC/pH seem to “jump,” first verify what you are measuring: water, fertigation solution, drain, substrate extract, or soil. If you suspect a real issue, confirm with an independent check (manual measurement, lab test for water, or periodic analyses), because on-site pH/EC monitoring complements laboratory analysis rather than replacing it. Practical decision: correct the likely cause (water source change, dosing, flushing, mixing uniformity) only after clarifying the medium. Check the result: follow the trend over several cycles rather than a single point, and relate it to salinity stress or nutrient lockout symptoms, which typically develop gradually.
8) Data freshness and commissioning errors: when the “problem” is only a data stream
Mechanism: fast decisions need fresh data. A sensor with infrequent transmissions, a weak battery, or a connectivity problem can create gaps or “plateaus” that look like perfect stability—or sudden jumps when the signal returns. In addition, incomplete commissioning (wrong units, wrong zone labeling, swapping probes between two sectors) can produce false comparisons: you think zone A is drier, but you mis-labeled the sensors.
What to observe and verify: when you see stuck values, implausible jumps, or lack of correlation with operations (you irrigated, but “moisture” doesn’t move), check battery status and reporting rhythm, and confirm the sensor is assigned to the correct zone. Confirm with an independent field observation and your operations log (when venting happened, when irrigation ran, when heating started). Practical decision: fix the data chain first (mounting, labeling, maintenance, connectivity), then return to agronomic interpretation. Check the result: after correction, data should respond to known events (irrigation/ventilation) in a repeatable way.
Conclusion
Good greenhouse diagnostics do not mean reacting to a number. They mean comparing microclimates, understanding what volume each sensor truly measures, and confirming the hypothesis with an independent check. When the mechanism is clear (radiation, drafts, water distribution, structural differences), decisions become targeted and the risk of interventions that “break something else” falls.
If you want to make these comparisons routine, use a sensor map and crop zones plus history, so “normal” is defined for each zone rather than for the whole greenhouse. GrowGuard can support this workflow through zone visualization and parameter alerts, but the real value comes from correct commissioning and disciplined field verification. For the right steps in your setup, ask for a placement-and-interpretation review before changing your crop strategy.