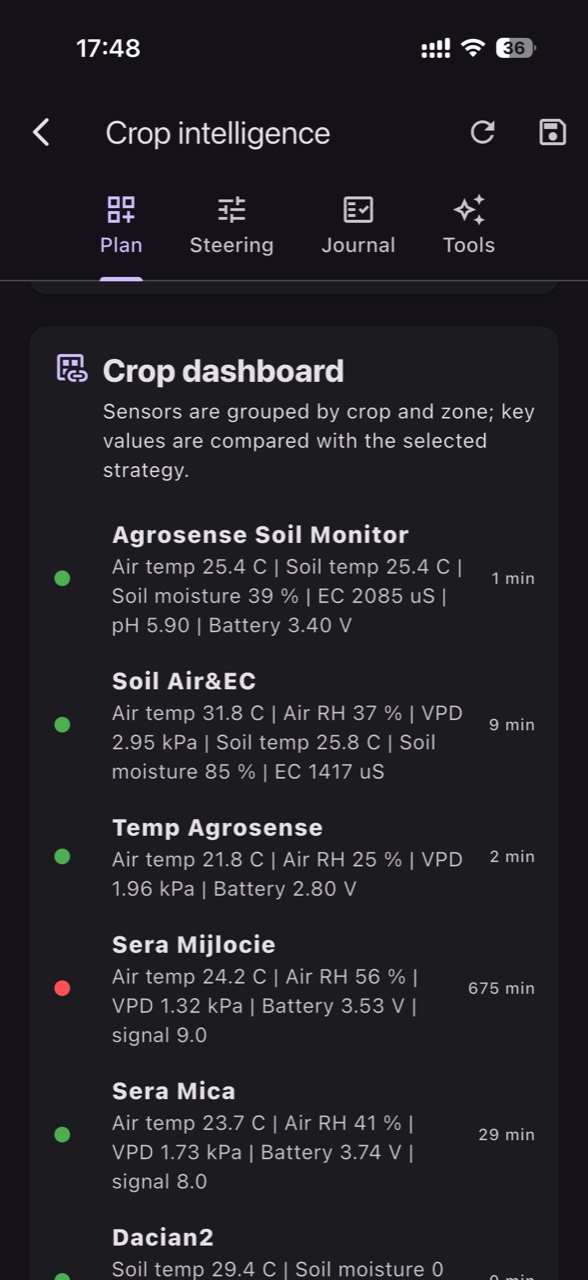
In greenhouses and tunnels, a “good decision” is not just reacting to a number. It is a chain: correct measurement, interpretation in context, an intervention, and then verification of the effect in the real crop. If one link is missing, you end up with ignored alarms, repeated actions without results, or losses caused by water stress and unstable microclimate.
A practical plan starts with a simple question: what exactly do you want to control in each phase of the season—root-zone stability in substrate, transpiration, condensation risk, salinity buildup, or zone-to-zone uniformity? Then you choose the right sensors, agree on units and data “freshness,” and define who checks what: the grower, greenhouse manager, technician, agronomist, or the sensor supplier.
The protocol below is a seasonal maintenance and verification routine: what changes from planting to peak season and to finish, how to independently validate observations (with inspections, control measurements and history), what practical decision to take, and how to confirm it worked. The examples are explicitly hypothetical and can be adapted to any vegetable or flower crop in protected production.
1) Team alignment: define “a decision” and assign responsibilities by role
A common mechanism behind disappointing implementations is confusing “monitoring” with “control.” Sensors do not irrigate, ventilate, or fertigate on their own; they describe a physiological and technical process. That is why the first step is a working agreement: what you are targeting (for example, keeping the root zone stable in substrate, or reducing night condensation), which indicators matter, and who has authority to change routines midweek.
What to observe: how many people make changes, for what reasons, and how often settings are altered “on the fly.” Independent verification: a short log (paper or digital) with three items—why the intervention was made, what was changed, and what sign would prove success. Practical decision: create a simple RACI (responsible, accountable, consulted, informed). Check the result through consistency: fewer contradictory actions, more changes followed by confirmation in data and plants.
2) Commissioning: units, measurement medium, and data “freshness”
A reading can be accurate and still lead to a wrong decision if the measurement medium is misunderstood. EC in a fertigation solution is not the same as EC from a substrate extract or bulk-soil EC. Likewise, VPD calculated from air temperature and relative humidity is an estimate; leaf temperature may be cooler or warmer than air, especially near vents, screens, glazing, or in drafts. A temperature sensor does not measure pH/EC; those require dedicated probes.
What to observe: every channel has the correct units, and the reporting interval fits greenhouse dynamics. Independent verification: spot-check with a control instrument (portable thermometer/hygrometer, or a calibrated pH/EC meter) and write down differences—do not stop at “seems fine.” Practical decision: define alert thresholds only after confirming measurement medium and data latency. Check the result by “clean alerts”: events align with what happens in the space, not with delays, unit mismatches, or stale timestamps.
3) Zone-based placement: capture the real microclimate, not the greenhouse average
In protected production, microclimates form from orientation, air leaks, fans, thermal screens, row ends, proximity to doors, and irrigation uniformity. If sensors are placed where it is convenient rather than representative, you will optimize a corner and penalize the rest. The mechanism is straightforward: plants respond locally through transpiration, leaf temperature, and water/nutrient uptake, and these responses are not uniform along a tunnel length.
What to observe: zones with different vigor, leaves that look glossier or feel softer, flower abortion, or repeated morning condensation on one side. Independent verification: a weekly walkthrough with standardized observations (same time, same points) and comparison against readings from that zone. Practical decision: move or add measurement points in “problem” areas and keep a reference zone. Check the result through convergence: differences between zones become explainable and actionable rather than recurring “mysteries.”
4) Seasonal routine: how the target shifts from planting to fruiting and to finish
Crop physiology changes what matters in the data. Early on, the root system is small and sensitive to swings; too much water reduces oxygen availability, while even short deficits can slow establishment. During strong vegetative growth and fruiting/flowering, transpiration increases, and microclimate (temperature, humidity, VPD) becomes the engine of water use; imbalance can trigger stress and quality variability. Toward the end, the goal often becomes stability and avoiding maturity problems or humidity-favored disease pressure.
What to observe: changes in daily rhythm (heat peaks, night drops, long high-humidity periods) and how the crop responds (morning turgor, afternoon droop, overall uniformity). Independent verification: repeat photos at the same points and record phenological stage; correlate with the sensor history. Practical decision: update thresholds and alert “windows” seasonally rather than keeping them fixed. Check the result by fewer late interventions: deviations are detected earlier and corrected the same day or next day.
5) Irrigation and the root zone: verify the effect, not only the command
In tunnels, many errors come from assuming “if we irrigated, it is corrected.” But roots experience a balance of water, air, and salts; if substrate/soil stays too wet, oxygen declines and nutrient uptake can become erratic. If water is insufficient, transpiration drops and leaf temperature tends to rise. In parallel, system uniformity (drippers, filters, pressure) determines whether a single point’s data represents a whole sector or only one row.
What to observe: row-to-row differences, stress peaks at predictable hours, or sectors that do not “start” the same way. Independent verification: a practical field test—check flow at line ends, look for clogging, and confirm that root-zone moisture actually changes after an irrigation rather than staying flat. Practical decision: adjust duration/frequency only after confirming the system delivers uniformly. Check the result through response: the moisture curve moves predictably and plants in the corrected sector reduce symptoms within 24–72 hours (hypothetical).
6) pH and EC: separate water, solution, and crop medium—then validate
pH and EC only make sense if you clearly state where you measure. Source water, fertigation solution, drainage, and substrate/soil extract are different media with different interpretations. Water-quality assessment (including alkalinity) is typically done with laboratory analysis; on-site pH/EC monitoring complements laboratory work, it does not replace it. EC does not identify which nutrient is missing; it indicates total dissolved salts, so it flags salinity risk or concentration shifts.
What to observe: gradual drift in pH or EC, step changes after recipe adjustments, or large differences between sectors. Independent verification: periodic calibration of instruments and a control measurement with a separate meter, plus a lab sample when persistent discrepancies appear. Practical decision: before “correcting” fertilization, clarify whether the issue is in source water, dosing, mixing, or accumulation in the root zone. Check the result via stabilization: variability becomes smaller and tied to deliberate changes rather than measurement error.
7) Microclimate, VPD, and condensation: small interventions verified the next night
Condensation and high humidity occur when air cools toward saturation; leaves and structure can become “cold surfaces” that collect water. That increases disease risk, but risk alerts are not pathogen detection; they are signals that conditions favor infection and scouting should intensify. VPD calculated from air readings is useful for trends, but near the canopy leaf temperature can differ, so interpretation must be anchored in direct observation.
What to observe: night periods with persistent humidity, zone differences (near walls, doors), and visible water on leaves in the morning. Independent verification: inspect visually before sunrise or at first entry, note where condensation appears, and correlate with history. Practical decision: adjust ventilation/heating/shading strategies (as an operational project, not as an automatic default function) and track whether the critical window shortens. Check the result immediately: the next night, the “wet window” duration drops and the affected zone shrinks (hypothetical).
8) Maintenance and failure cases: drift, stuck values, and network problems
Data can look “perfect” when a sensor has drifted or become stuck. A constant signal for many hours, a rapidly declining battery, unrealistic jumps, or missing synchronization are investigation triggers. Mechanisms differ: drift is gradual (contamination, aging, poor installation), while connectivity issues tend to be sudden and linked to coverage, interference sources, or power. Without distinguishing them, the team ends up “treating the crop” when it is actually treating a measurement problem.
What to observe: repeated alarms with no field confirmation—or the opposite, plant symptoms without alarms. Independent verification: a monthly audit list—compare sensors against each other under similar conditions, check mounting, clean/replace consumables where relevant, and confirm timestamps are current (freshness). Practical decision: agree with the sensor supplier on an intervention protocol: what gets recalibrated, replaced, or relocated. Check the result through coherence: sensor differences become stable and explainable, and history has fewer suspicious gaps or flatlines.
Conclusion
A successful sensor season is not about having many graphs; it is a repeatable process: define phase-specific objectives, commission with correct units, place sensors by zones, make small interventions, and verify effects in plants and in the irrigation/climate system. When the grower sets priorities, the team follows the protocol, and the sensor supplier ensures correct measurement and maintenance, decisions become faster and better justified.
GrowGuard can support this way of working with zone monitoring, alerts, and history for verification—without replacing greenhouse inspection and control measurements. If you want, you can turn the steps above into a farm-specific worksheet: roles, an audit list, and a calendar of checks for each crop and sector.