Ventilation in a greenhouse or plastic tunnel is not just “air out when it’s hot.” Most of the time, the real problem is balancing temperature, humidity, and how fast the plant is losing water through transpiration. This is where VPD (vapour pressure deficit) helps: an indicator derived from air temperature and relative humidity, used as a finer decision reference than “open at 28°C.”
In practice, VPD-driven ventilation is difficult for two reasons: the microclimate is not uniform, and sensors can be installed or interpreted incorrectly. The same tunnel can show consistent differences between ends, between rows, near doors, or close to a heating source. If settings are global, you will “fix” one zone and harm another without understanding why.
This article explains the fundamentals and a zone-based commissioning workflow: how to choose and check temperature/humidity sensors, how to define useful zones, how to build VPD alerts without false alarms, and how to independently verify that ventilation produces the intended effect. The examples are hypothetical and must be adapted to each crop and protected structure.
1) Why VPD changes ventilation logic compared to simple thresholds
Mechanism: VPD describes the “pull” the air has to take water vapour from the leaf surface. At the same temperature, higher relative humidity means lower VPD; the plant transpires less easily, and leaves stay wet longer, increasing the risk of condensation and physiological issues. With low humidity and warm air, VPD rises; the plant can transpire excessively, leading to water stress, calcium-related imbalances, and tip burn in some species.
What to observe: periods when leaves look “heavy,” with droplets or a fine film in the morning, or the opposite—midday wilting even though the root zone is wet. What to verify independently: the difference between air temperature and leaf temperature (a leaf may be cooler from transpiration, or warmer under water stress), plus whether condensation is actually present on plants or film. Practical decision: steer ventilation or dehumidification by VPD, not temperature alone. How to check results: after the intervention, confirm VPD stabilises and leaf-wetness duration drops, without excessive temperature swings.
2) Correct zoning: how to split a greenhouse/tunnel so averages don’t lie
Mechanism: air moves unevenly; tunnels commonly develop cold “pockets” at the ends and high-humidity zones near sidewalls or curtains. In glass or poly greenhouses, fan flows, vents, screens, and heating create layers. If you place one sensor in the centre, it may show a “good” VPD while near doors you have low VPD and condensation. Zoning means defining areas with distinct climate behaviour, not simply adding more sensors at random.
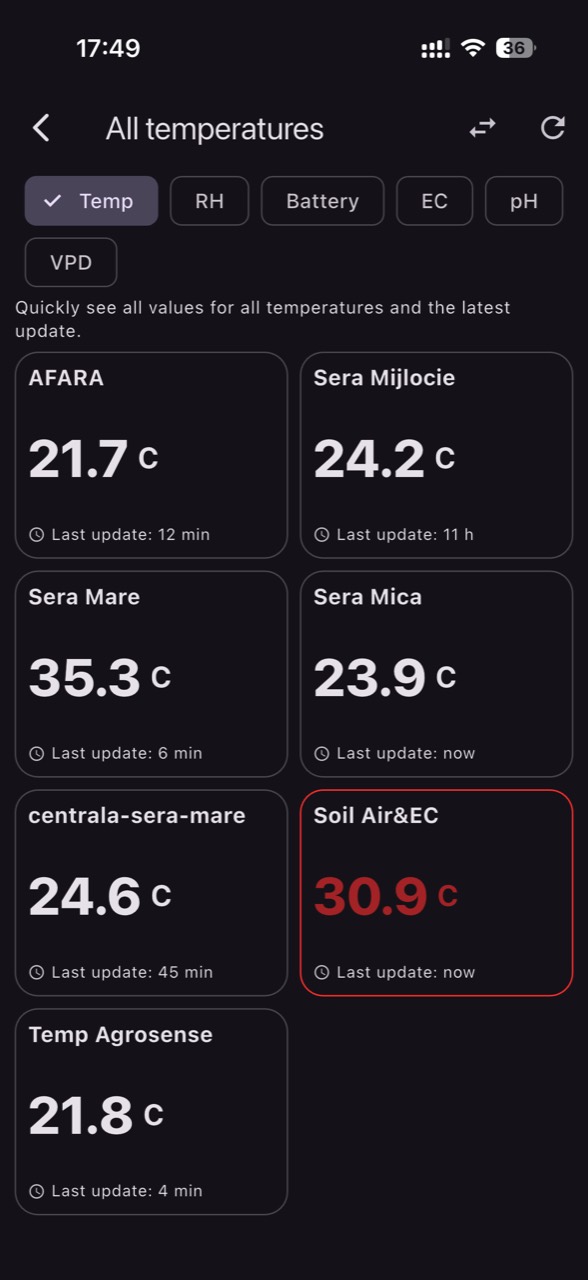
What to observe: visible differences in vigour, disease appearing on certain rows, or windows/doors that “fog up” consistently. What to verify independently: a daily walk at the same times with a handheld thermo-hygrometer to confirm zones truly differ. Practical decision: define 3–6 useful zones (for example: north end, south end, centre, near doors, under a screen). In a platform like GrowGuard you can map sensors to zones so alerts reflect local reality. How to check results: after 1–2 weeks, compare zone histories and confirm differences are stable and actionable rather than noise.
3) Sensor choice: what matters in temperature/humidity measurements for VPD
Mechanism: VPD is calculated from air temperature and relative humidity, so errors or delays in either measurement multiply into the result. You need dedicated temperature and humidity sensors with response fast enough to capture changes after vents open. A sensor that “lags” or drifts on humidity will generate false VPD and alerts that push unnecessary ventilation events.
What to observe: humidity values that appear “stuck,” or implausible jumps after an action (for example, vents opened but the graph does not move at all). What to verify independently: spot-check against a reference handheld instrument and confirm placement (not pressed against plastic, not in direct jet flow, not above a water source). Practical decision: use radiation shielding/aspiration where sun heats the sensor body, and keep the same measurement height across zones (near canopy level). How to check results: after an intervention, temperature and RH should change logically and in reasonable synchrony between zones, without unexplained delays.
4) Data freshness and units: when it’s “too late” for a good decision
Mechanism: ventilation is a fast process control. If data arrives infrequently or late, you will react after the event has passed (for example, the morning humidity peak). During commissioning you therefore set a suitable reading frequency and monitor “freshness”: the time of the latest measurement and continuity of the series. A VPD calculated from a current temperature and an old humidity value is effectively wrong.
What to observe: alerts that arrive after you already solved the issue manually, or charts that look like sparse “steps” unrelated to actions in the structure. What to verify independently: keep a simple action log (when vents were opened, when circulation fans ran) and compare it to data timestamps. Practical decision: choose a sampling rate that captures transitions (denser during critical hours such as morning and midday), and design alerts with persistence (the condition must hold for a period, not just one point). How to check results: after adjustments, alerts arrive during the event and curves show visible responses to interventions.
5) A 7-step commissioning workflow for VPD-driven ventilation
Step 1: define the purpose (morning dehumidification, preventing midday stress, reducing night condensation) and document crop constraints. Tomatoes, cucumbers, and peppers, for example, differ in how they react to transpiration stress and to time spent with wet leaves; in sensitive phases, abrupt fluctuations can affect fruit set or trigger physiological problems. Step 2: choose zones and mounting points. Step 3: install sensors and check shielding and height.
Step 4: do an operational calibration (not necessarily metrology-grade calibration): co-locate sensors for 30–60 minutes to detect an outlier. Step 5: set initial thresholds based on your own history (1–2 weeks) and agronomic guidance for your crop, without copying “universal” setpoints. Step 6: configure temperature, RH, and VPD alerts with persistence, by zone. Step 7: run a one-week validation: record action → sensor response → crop observation. In GrowGuard you can view zone history and placement, but commissioning remains a field discipline.
6) Useful alerts: avoiding false alarms and wrong reactions
Mechanism: many false alarms come from thresholds set without context and from short events (for example, a cold gust when a door opens). A good alert translates a plant-relevant condition and requires stability: exceedance over time, or a combination (high temperature plus high VPD). Zone differences are also a signal: if only one end of the tunnel has low VPD, the issue is local (circulation, infiltration, obstacles), not “overall climate.”
What to observe: frequent notifications that get ignored, or interventions that clear one alarm but create another (temperature drops and humidity spikes). What to verify independently: after each alert, visually confirm the correlated symptom (condensation, drooping leaves, “heavy” air) and check the sensor is not exposed to direct jets or splashing. Practical decision: build tiered alerts—warning (watch), critical (act), and “between-zone difference” (investigate locally). How to check results: after 2–3 weeks, alert volume drops and the remaining alerts lead to actions with measurable effects in the graphs.
7) Typical interventions and how to validate them: ventilation, heating, circulation
Mechanism: ventilation usually lowers temperature and can lower absolute humidity, but relative humidity may rise or fall depending on outdoor air and on how much the inside cools. That is why “vent to reduce RH” is not always true. Sometimes effective dehumidification needs a small heat input (increasing air’s moisture-holding capacity) combined with air exchange. Internal circulation reduces stratification and zone-to-zone differences.
What to observe: after venting, temperature drops quickly, RH climbs, VPD falls, and condensation appears; or VPD jumps too high and the crop shows stress. What to verify independently: check outdoor temperature and RH (a local weather station or an outdoor sensor) to understand the direction of air exchange. Practical decision: choose interventions by objective: to raise VPD without overheating, combine circulation with a smaller vent opening; to reduce RH without thermal shock, staged ventilation and (where available) short heating pulses can be more stable. How to check results: look for a gradual response, not “sawtooth” VPD patterns.
8) Failure cases: when data looks “good” but the plant says otherwise
Mechanism: VPD computed from air is an estimate; leaf temperature can differ, especially under strong radiation, in airflow, or when the plant is water-stressed. A “correct” VPD in data does not guarantee stomata are open or transpiration is normal. Also, a sensor can be accurate but unrepresentative (above an aisle, in a corner). Another failure is measurement confusion: a temperature sensor cannot tell you anything about EC/pH—those require dedicated probes in the correct medium.
What to observe: stable climate data, but tip burn, flower abortion, marginal necrosis, or disease appearing in one zone. What to verify independently: check root-zone moisture (substrate/soil) using a dedicated sensor or manual checks, because water stress can mimic “too high VPD.” If you also monitor EC/pH, clarify the medium: EC in source water, fertigation solution, substrate extract, or bulk soil are different measurements and should not be compared directly; on-site pH/EC monitoring complements laboratory analysis rather than replacing it. Practical decision: when the crop contradicts the data, suspect representativeness (sensor location) first, then data freshness, and only then settings. How to check results: after relocating or adding a sensor in the problem zone, differences become visible in history and you can connect interventions to effects.
Conclusion
Smart ventilation with VPD, temperature, and humidity is not a set of “magic” thresholds; it is disciplined commissioning: zoning, correct sensor installation, fresh data, persistence-based alerts, and validation on the crop. The most valuable outcome is clarity—where the problem starts, when it begins, and which intervention changes it in a measurable way.
If you want to operationalise this workflow as a team, a monitoring platform such as GrowGuard can help with zone visualisation and configurable alerts, but the protocol stays the same: observe, independently verify, decide, and confirm effects in both data and plants. For a fast start, begin with three zones, two weeks of history, and a single alert rule you refine gradually.