In lettuce and other leafy greens, uniformity is lost quickly: leaves react to heat stress, short dry-downs in the surface layer, and periods of humid air that keep foliage wet for too long. That is why the “greenhouse average” can be misleading. Good decisions come from comparing real crop zones and doing short, on-the-ground checks.
A poorly placed sensor can show a risk that does not exist within the crop canopy—or, conversely, can miss a cold edge zone with condensation. In addition, VPD calculated from air temperature and relative humidity is only an estimate: leaf temperature can differ, especially near walls, in air currents, or under shading. For diagnosis, you need multiple points and clear validation rules.
This guide is diagnostic: how to separate a real crop issue (irrigation, ventilation, uneven distribution) from a “suspect” reading (drift, installation, units, stale data). For each situation, we cover the mechanism, what to observe in the crop, what to verify independently, a practical decision, and how to check the result by comparing microclimates across zones.
1) Define zones before moving a single sensor
Mechanism: in leafy greens, the difference between a “good” area and a “problem” area is often a small combination of temperature, air movement, and water status in the root zone. If you do not define zones, you will mix signals: a cold corner can trigger humidity/condensation alerts, while the center can be drying out at the same time. Observe the crop map: edges, row ends, near doors, near heat sources, and under films/shading.
Independent verification: take a “3-minute walk” at different times and note where leaves look glossy, where substrate/soil dries faster, and where lettuce stays smaller. Practical decision: set 3–5 fixed zones (for example: north edge, south edge, center, near the door, near heating) and compare only between them, not only against a single global value. Check the result by trend convergence: after adjustments, differences between zones should shrink over time, not necessarily instantly.
2) Air sensor placement: “leaf level” is not “on a post”
Mechanism: in dense crops, the air layer between leaves has different humidity and temperature than air at head height. If the air sensor is too high or in direct airflow (fan, door, vent), you may see a “nice” VPD that does not describe the leaf, or abrupt dry spikes that are just airflow on the sensor. Observe: row-to-row size differences and leaf-edge burn only in certain lines.
Independent verification: use a simple thermometer (hypothetically) for quick comparisons between center and edge at the same height as the leaves. Check whether the sensor is shaded and protected from direct radiation; otherwise it may “read” housing warming. Decision: mount at least one air sensor at leaf level in a representative zone and one in a “suspect” zone (edge/corner). Check the result: after relocation, the signal should become slower and more consistent with what you see on the leaf, not wildly erratic.
3) VPD and condensation: when numbers look alarming but the leaf says otherwise
Mechanism: condensation risk appears when surfaces (leaves, plastic, metal) cool below the air’s dew point. The sensor measures air temperature and relative humidity; derived VPD does not directly “see” leaf temperature. In a cool, wet microclimate, leaves stay wet longer, increasing disease pressure in a dense crop even if the greenhouse average temperature looks acceptable. Observe: leaves sticking together, a water film in the morning, a “closed” smell.
Independent verification: visually check condensation on plastics and on leaves in the zone where the sensor flags high humidity. If you have two zones, compare: is wetness only at the edge? Decision: adjust ventilation/heating in a targeted way to shorten leaf-wet periods (for example with brief venting at key moments), not by generically “lowering humidity.” Check the result: track the duration of high-humidity episodes in the problem zone and compare with a control zone; reducing duration matters more than one isolated peak.
4) Soil/substrate moisture: sensor depth decides which “problem” you see
Mechanism: lettuce has relatively shallow roots and reacts to rapid wet–dry alternations in the upper layer, especially in light substrates or soils that crust. A sensor installed too deep can show “wet” while the active root zone is already dry; conversely, a very shallow sensor can exaggerate drying after ventilation. Observe: plants that “collapse” at midday and recover in the evening, or uneven growth that follows specific rows.
Independent verification: do a manual check: take a handful of soil/substrate from the rooting depth and evaluate cohesion and smell (hypothetically). Compare that with the sensor reading in the same zone. Decision: place sensors at depths relevant to the crop stage and record stage by zone; in short cycles, the practical “root zone” shifts over time. Check the result: after irrigation, the moisture curve should rise and then gradually decline; if it stays flat, suspect poor soil contact or incorrect positioning.
5) Irrigation non-uniformity or a sensor problem? The “control zone” test
Mechanism: in leafy crops, a partially clogged dripper line or a pressure difference within a sector can produce smaller rows and locally low moisture readings. But a sensor installed right next to a dripper (or in an air pocket in substrate) can also “see” too much or too little water. Observe: repeatable differences on the same rows, not random patches, and rougher leaf texture in drier areas.
Independent verification: run a simple hypothetical test: trigger a short irrigation and check whether all watering points in that sector start similarly (visual/approximate flow), then compare the sensors’ response in two zones. Decision: keep a stable control zone (with a sensor and no interventions that day) and intervene only in a suspect zone; if only the intervened zone changes, you have confirmation. Check the result: if after intervention (flushing, replacing drippers, balancing pressure) the moisture gap shrinks and the crop becomes more uniform, the cause was water distribution, not “general climate.”
6) Stale data, units, and “stuck” values: quick triage of misleading readings
Mechanism: sometimes the “problem” is that data is no longer fresh or the sensor reports a constant value, and you react as if something is happening in the crop. In diagnosis, trends and timing relative to events (irrigation, venting, sunrise) matter more than a single number. Observe: alerts that do not match what you see in the house and curves that do not change for hours although conditions obviously changed.
Independent verification: compare two sensors in nearby zones; if one moves and the other stays “frozen,” suspect the reading, not the crop. Also verify units: soil moisture may be percent, volumetric, or another scale depending on the sensor; without clarity, comparisons become wrong. Decision: run a mini-audit: check data freshness, battery/status, and coherence with operational events. In GrowGuard, status/battery alerts can help with this separation, but the final confirmation is still on-site. Check the result: after remediation (repositioning, reconnecting, replacing), the curve should become reactive to events again.
7) EC/pH: when leaf symptoms are mistaken for “climate”
Mechanism: leafy greens can show marginal burn, slow growth, or brittle leaves due to high salinity, unsuitable pH, or variability in fertigation solution—not only due to temperature/humidity. Important: temperature/humidity does not measure EC or pH; these require dedicated probes and you must know the measurement medium. EC in irrigation water, in fertigation solution, and in a substrate/soil extract are different measurements and are not interpreted the same way.
Independent verification: if you suspect nutrition, separately check the water and the fertigation solution with appropriate instruments (hypothetically) and, when needed, via laboratory analysis; on-site pH/EC monitoring complements analysis, it does not replace it. Decision: before “correcting climate,” look for correlations: do symptoms appear in all zones or only where irrigation differs? If EC increases over time in the root zone, adjust the irrigation/fertigation approach to avoid accumulation. Check the result: watch whether new symptoms lessen and zone differences shrink; EC does not identify individual nutrients, so confirming specific elements requires other methods.
8) Microclimate comparison protocol: from suspicion to a verified decision
Mechanism: good diagnosis uses a hypothesis and a controlled comparison. For example, hypothetically, you have a center zone with rapid dry-down and an edge with condensation. Without a protocol, you may over-ventilate (drying the center even more) or increase irrigation (worsening edge wetness). Observe simultaneously: leaf appearance, drying speed of soil/substrate, and the hours when extremes occur (morning, after midday, after irrigation).
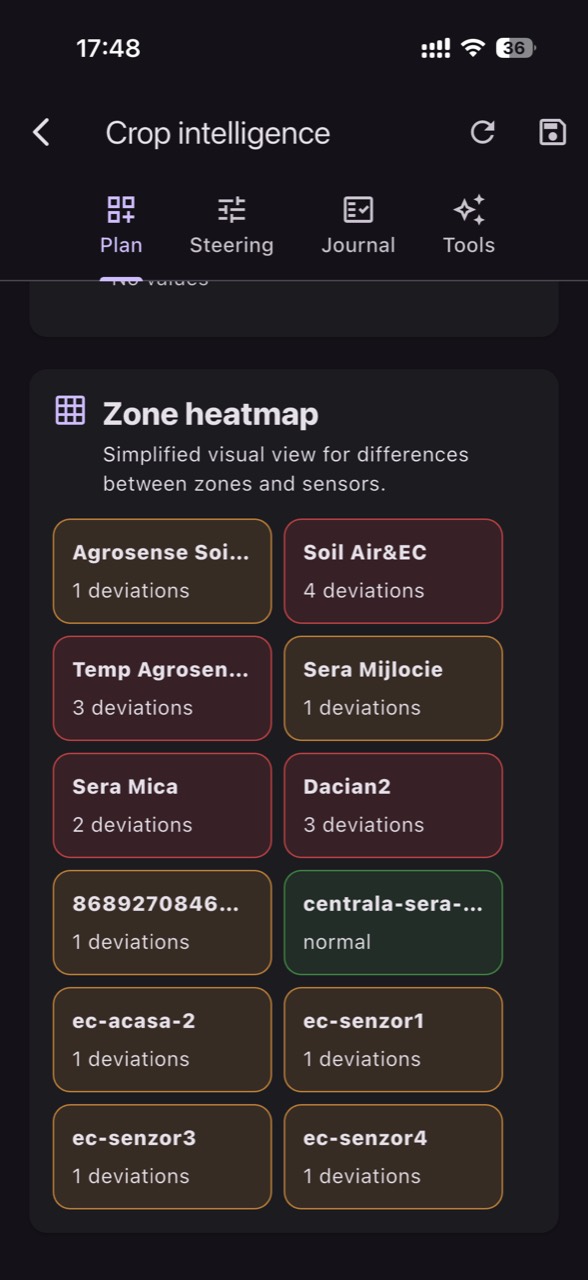
Independent verification: choose a “test day” when you change only one thing—only the duration of a venting event, or only irrigation timing for one sector. Decision: write down what you expect to change in readings and in the crop; then verify whether the change appears in the targeted zone and not in the control zone. Check the result: if the signal shifts as expected (fewer hours with wet leaves, smoother moisture curves, smaller edge-to-center differences), keep the decision; if not, revert and look for an alternative cause (sensor position, water distribution, air currents). In GrowGuard, you can follow these comparisons by zone, but the conclusion must be validated by direct leaf observation.
Conclusion
In lettuce and other leafy greens, microclimate happens “by meters,” not by hectares: the edge, the door, the cold corner, and the center can live in different conditions within the same hour. When readings look dramatic, first distinguish: is it a real crop phenomenon or an effect of placement, depth, units, or stale data? Then compare zones and change one factor at a time to get a verifiable response.
If you want to make these comparisons easier across a team, a monitoring platform such as GrowGuard can help with zone-based visualization and sensor status alerts, but the key remains the field protocol: observation, independent verification, and confirmation through results.